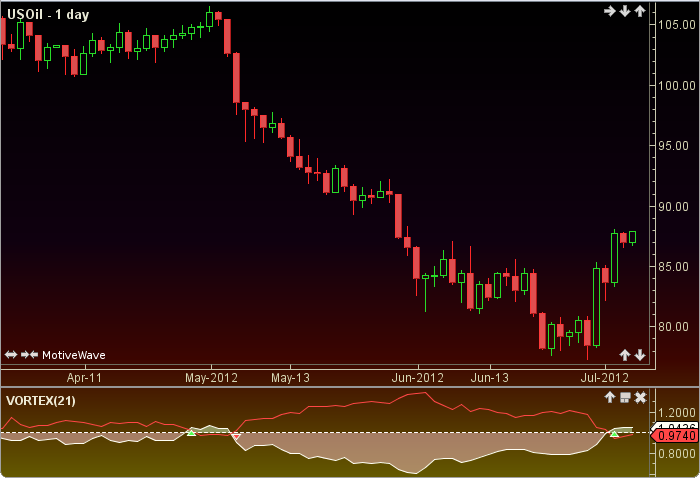
Vortex Indicator
The Vortex Indicator was invented by Etienne Botes and Douglas Siepman. It is a trend reversal indicator. Two paths are plotted a viPlus and a viMinus. When the two paths cross a change in the trend is indicated and trading signals are generated. The indicator may be used in any market and any time frame. The user may change the period length which has a default value of 21. This indicator’s definition is further expressed in the condensed code given in the calculation below.
Click here for more information on the Vortex Indicator.
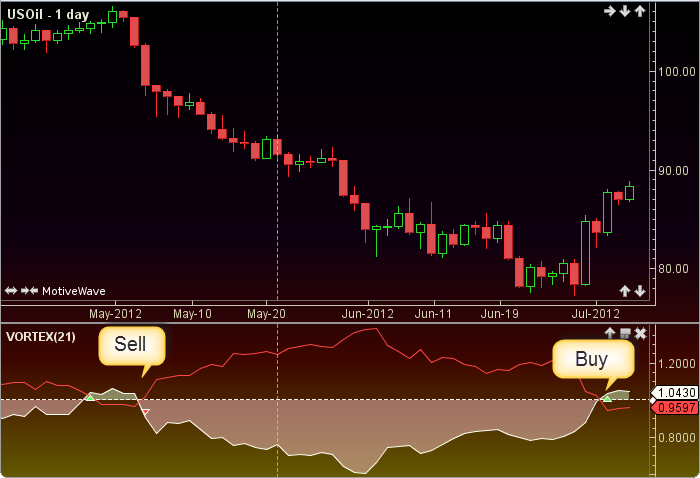
How To Trade Using Vortex Indicator
The vortex indicator may be used alone or with other indicators, in particular a trailing stop may be useful. Sell signals are generated when the viPlus crosses below the viMinus. Conversely, buy signals are given when the viPlus crosses above the viMinus. If using short time frames (minute bars) the default period of 21 should be increased.
How To Access in MotiveWave
Go to the top menu, choose Study>Oscillators>Vortex Indicator
or go to the top menu, choose Add Study, start typing in this study name until you see it appear in the list, click on the study name, click OK.
Important Disclaimer: The information provided on this page is strictly for informational purposes and is not to be construed as advice or solicitation to buy or sell any security. Please see our Risk Disclosure and Performance Disclaimer Statement.
Calculation
//period = user defined, default is 21
//tr = true range
//abs = absolute value
//prev = previous, index = current bar number
//vi = vortex indicator
tr = getTrueRange(index);
prevLow = low[index-1];
prevHigh = high[index-1];
vPlus = abs(high - prevLow);
vMinus = abs(low - prevHigh);
sumTr = sum(index, period, tr);
sumVplus = sum(index, period, vPlus);
sumVminus = sum(index, period, vMinus);
Plot1: viPlus = sumVplus / sumTr;
Plot2: viMinus = sumVminus / sumTr;
//Signals
buy = crossedAbove(viPlus, viMinus);
sell =crossedBelow(viPlus, viMinus);