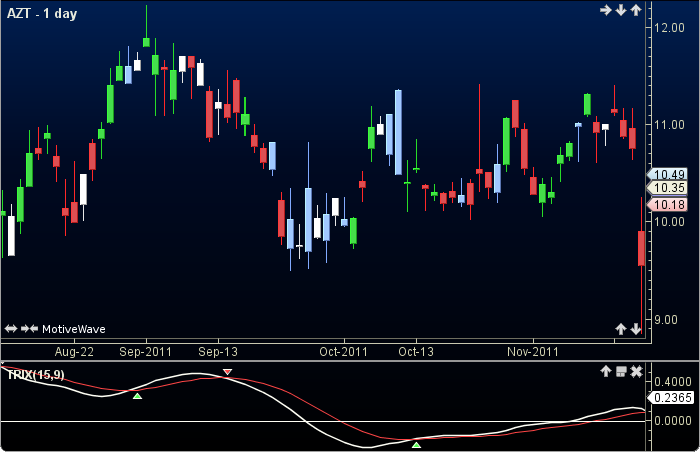
TRIX
The TRIX oscillator was developed by Jack Hutson in the 1980s. The TRIX displays, the percent rate of change, of 3 iterations of an exponentially smoothed moving average of an instrument. Oscillating around the zero line, TRIX is designed to filter out stock movements that are insignificant to the larger trend. The user may change the input (close) and period lengths. This indicator’s definition is further expressed in the condensed code given in the calculation below. Click here for more information.
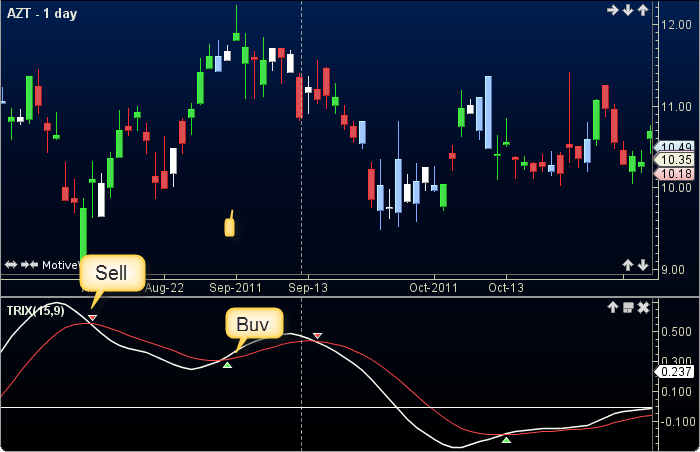
How To Trade Using TRIX
If the TRIX crosses above the SIG a sell signal will be generated, Conversely, if the TRIX crosses below the SIG a buy signal will be given.
How To Access in MotiveWave
Go to the top menu, choose Study>General>TRIX
or go to the top menu, choose Add Study, start typing in this study name until you see it appear in the list, click on the study name, click OK.
Important Disclaimer: The information provided on this page is strictly for informational purposes and is not to be construed as advice or solicitation to buy or sell any security. Please see our Risk Disclosure and Performance Disclaimer Statement.
Calculation
//input = price, user defined, default is close
//period = user defined, default is 15
//period2 = user defined, default is 9
//EMA = exponential moving average
//ma = moving average, prev = previous
//index = current bar number, sig = signal
ma1 = ma("EMA", index, period, input);
ma2 = ma("EMA", index, period, MA1);
ma3 = ma("EMA", index, period, MA2);
prevMA3 = MA3[index-1];
TRIX = 100 * ((ma3 - prevMA3)/prevMA3);
sig = ma("EMA", index, period2, TRIX);
// Signals
buy =  crossedAbove(TRIX, SIG);
sell = crossedBelow(TRIX, SIG);