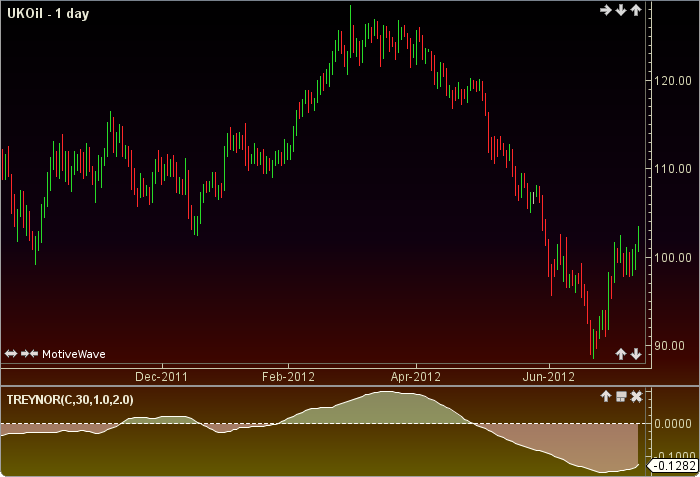
Treynor Ratio
The Treynor Ratio or Measure was authored by Jack L. Treynor. It is designed to evaluate how well an investor is compensated for the risk taken. The higher the Treynor the better the instrument’s performance. The main ingredients are current price and a prior price which are adjusted with the user defined safe return. A user defined safe return is subtracted from average return and divided be a user defined beta number. The user must select linear bars but may change the input (close), period length, beta and a safe return value. This indicator’s definition is further expressed in the condensed code given in the calculation below.
See Treynor Ratio
See also Sharpe Ratio
How To Trade Using the Treynor Ratio
The Treynor Ratio may be used to evaluate a instrument’s performance. No trading signals are calculated.
How To Access in MotiveWave
Go to the top menu, choose Study>Performance>Treynor Ratio
or go to the top menu, choose Add Study, start typing in this study name until you see it appear in the list, click on the study name, click OK.
Important Disclaimer: The information provided on this page is strictly for informational purposes and is not to be construed as advice or solicitation to buy or sell any security. Please see our Risk Disclosure and Performance Disclaimer Statement.
Calculation
//input = price, user defined, default is close
//period = p1, user defined, default is 30
//beta = user defined, default is 1
//safe = safe return percentage, user defined, default is 2
//av = average, pow = power
//sma = simple moving average, sdDev = standard deviation
//index = current bar number
barMin = 0;
BarSize bar = getBarSize();
if (bar.getType() == BarSizeType.LINEAR) barMin = bar.getInterval();
else return;
minPerYr = 60*24*30*12;
barsPerYr = minPerYr/barMin;
adjSafe = Math.pow((1 + (safe)), p1/barsPerYr) - 1;  //safe return per period compounded
priorP = price[index-p1];
ret = (price/priorP)-1
av = sma(index, p1, RET);
Plot: treynor = (av - adjSafe) / beta;