TFS Tether Line
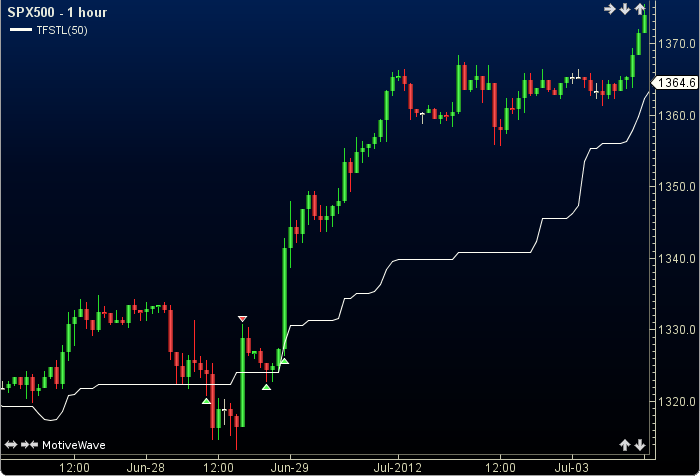
The TFS Tether Line was authored by Bryan Strain in Stocks and Commodities Mag.06/2000. The Tether line is a 50 period midpoint price. The user may change the period value. This indicator’s definition is further expressed in the condensed code given in the calculation below.
How To Trade Using TFS Tether Line
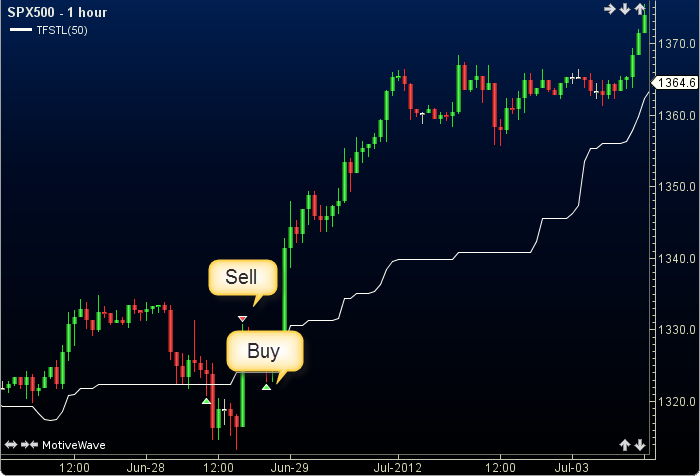
A sell signal will be generated if the high crosses above the TL. . Conversely, a buy signal will be given if the low crosses below the TL.
How To Access in MotiveWave
Go to the top menu, choose Study>Overlays>TFS Tether Line
or go to the top menu, choose Add Study, start typing in this study name until you see it appear in the list, click on the study name, click OK.
Important Disclaimer: The information provided on this page is strictly for informational purposes and is not to be construed as advice or solicitation to buy or sell any security. Please see our Risk Disclosure and Performance Disclaimer Statement.
Calculation
//period = user defined, default is 50
//prev = previous, MT = moreThan, LT = lessThan
//index = current bar number
highest = highest(index, period, high);
lowest = lowest(index, period, low);
Plot: tl = (highest + lowest) / 2;
//Signals
prevHigh = high[index-1];
prevLow = low[index-1];
prevTl = tl[index-1];
sell = (prevTl MT prevHigh AND tl LT high );
buy = (prevTl LT prevLow AND tl MT low);