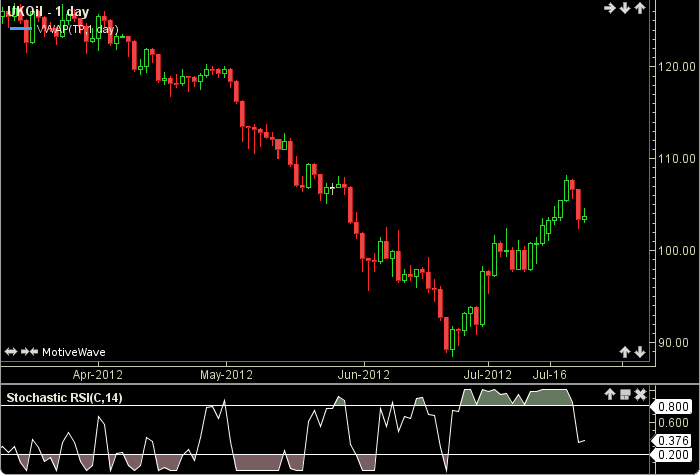
Stochastic RSI
The Stochastic RSI oscillator measures the level of the RSI (Relative Strength Index) as compared to its range over a given time period. The RSI is used as the foundation, and the Stochastics formula is applied to produce an oscillator that fluctuates between 0 and 1. The user may change the input (close), period length and guide values. This indicator’s definition is further expressed in the condensed code given in the calculation below.
Click here for more information on the RSI.
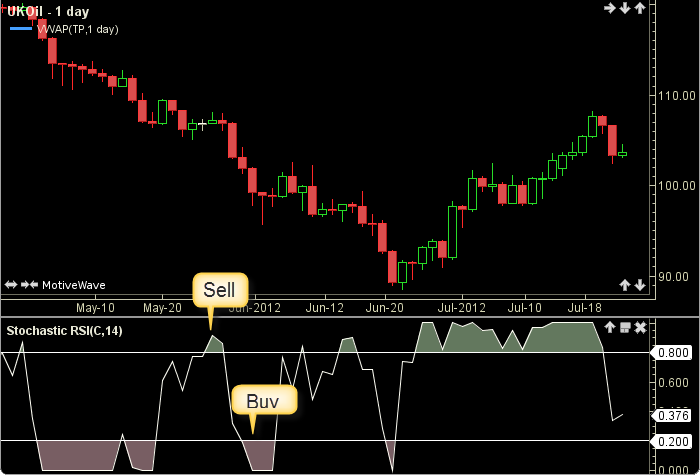
How To Trade Using Stochastic RSI
Adjust the top and bottom guides to control the quantity and quality of the trading signals. If the K crosses above the top guide a sell signal will be generated. Conversely, if the K crosses below the bottom guide a buy signal will be given.
How To Access in MotiveWave
Go to the top menu, choose Study>Tushar Chande>Stochastic RSI
or go to the top menu, choose Add Study, start typing in this study name until you see it appear in the list, click on the study name, click OK.
Important Disclaimer: The information provided on this page is strictly for informational purposes and is not to be construed as advice or solicitation to buy or sell any security. Please see our Risk Disclosure and Performance Disclaimer Statement.
Calculation
//input = price, user defined, default is closing price
//period = user defined, default is 14
//index = current bar number
//LT = less than, LOE = less or equal
//MT = more than, MOE = more or equal
//Step 1: Calculate the RSI

prevPrice = price[index-1];
diff = price - prevPrice;
up = 0, down = 0;
if (diff moreThan 0) up = diff;
else down = diff;
down = Math.abs(down);
avUp = ma(rsiMethod, index,  rsiPeriod, UP);
avDn = ma(rsiMethod, index,  rsiPeriod, DOWN);
dSum = avUp + avDn;
rsi = (avUp / dSum) * 100.0;

//Stochastics calculation
high = highest(index, fastKPeriod, RSI);
low = lowest(index, fastKP, Values.RSI);
fastK = 0;
if (high == low) fastK = 100;
else fastK = (rsi-low) / (high-low) * 100;
Plot2: slowk = ma(sigMethod, index, slowKPeriod, FASTK);
Plot3:sig = ma(sigMethod, index,  sigPeriod, SLOWK);

//Signals
prevK = K[index-1];
sell = crossedBelow(SLOWK, SIG) AND slowk moreThan topGuide;
buy = crossedAbove(SLOWK, SIG) AND slowk lessThan bottGuide;