Spearman Indicator
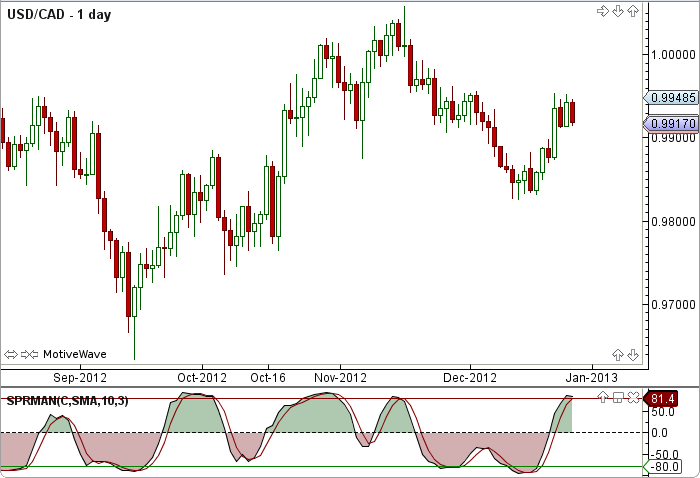
The Spearman Indicator is described by Dan Valcu in the Stocks and Commodities Magazine, February 2011. The indicator is named after Charles Spearman who was a British psychologist and mathematician of the late 19th and early 20th centuries. Spearman is a oscillator with values between +100 an -100. High plus values (+80) indicate an uptrend; high negative values (-80) represent a downtrend. A signal, which is a moving average of the Spearman, is also plotted. The user may change the input (close), method (SMA), period lengths and guide values. This indicator’s definition is further expressed in the condensed code given in the calculation below.
How To Trade Using the Spearman Indicator
No trading signals are calculated for this indicator.
How To Access in MotiveWave
Go to the top menu, choose Add Study, start typing in this study name until you see it appear in the list, click on the study name, click OK.
Important Disclaimer: The information provided on this page is strictly for informational purposes and is not to be construed as advice or solicitation to buy or sell any security. Please see our Risk Disclosure and Performance Disclaimer Statement.
Calculation
//input = price, user defined, default is closing price
//method = moving average, user defined, default is SMA
//n = Spearman period, user defined, default is 10
//sigPeriod = signal period, user defined, default is 3
size = series.size();
r1[] = new int[n+1];
r22[] = new int[n+1];
r11[] = new double[n+1];
r21[] = new double[n+1];
temp = 0;
coefcorr = 0, sc = 0;
changed = 0, found = 0;
absum = 0, ab = 0, ab2 = 0 ;

for (int k = n; k lessThan size; k++ )
     for (int i = n; i moreOrEqual 1; i--)
        r1[i] = i;
        r22[i] = i;
        r11[i] = series.getDouble((k - n + i), key, 0);
        r21[i] = series.getDouble((k - n + i), key, 0);
      endFor
      //sort r21 descending
      changed = 1;
      while (changed moreThan 0)
        changed = 0;
        for (int i = 1; i lessOrEqual (n-1); i++)
          if (r21[i+1] lessThan r21[i])
            temp = r21[i];
            r21[i] = r21[i + 1];
            r21[i+1] = temp;
            changed = 1;
          endIf
        endFor
      endWhile
      ////
      for (int i = 1; i lessOrEqual n; i++)
        found = 0;
        while (found lessThan 1)
          for (int j = 1; j lessOrEqual n; j++)
            if (r21[j] == r11[i])
              r22[i] = j;
              found = 1;
            endIf
          endFor
        endWhile
      endFor
     /////////
      absum = 0;
      for (int i = 1; i lessOrEqual; i++)
        ab = r1[i] - r22[i];
        ab2 = ab * ab;
        absum = absum + ab2;
      endFor
      coefcorr = 1 - ((6 * absum) / (n * ((n * n) - 1)));
      Plot: sc = 100 * coefcorr;
      Plot: sig = ma(method, k, sigPeriod, SC);
 end