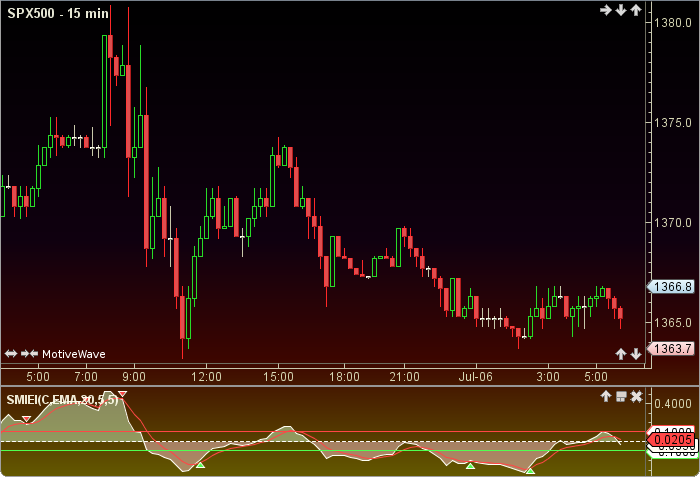
SMI Ergodic Indicator
The SMI Ergodic Indicator is the same as the True Strength Index (TSI) developed by William Blau, except the SMI includes a signal line. The SMI uses double moving averages of price minus previous price over 2 time frames. The signal line, which is an EMA of the SMI, is plotted to help trigger trading signals. Adjustable guides are also given to fine tune these signals. The user may change the input (close), method (EMA), period lengths and guide values. This indicator’s definition is further expressed in the condensed code given in the calculation below.
Click here for more information on the TSI.
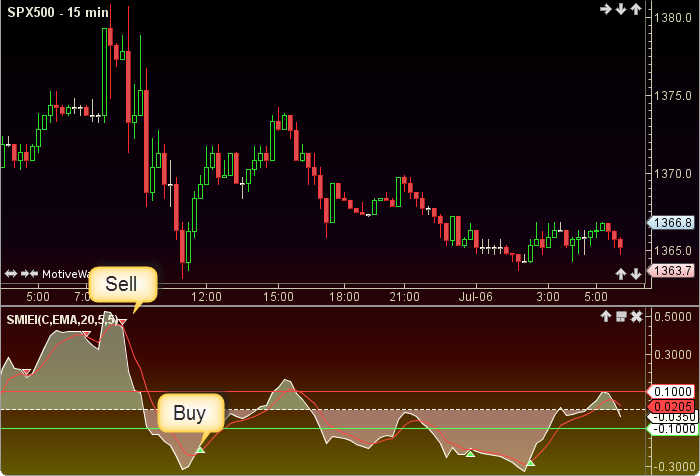
How To Trade Using SMI Ergodic Indicator
Adjust the top and bottom guides to control the quantity and quality of the trading signals. In addition to the guides, if the SMI crosses the signal line a change in trend is predicted. If the SMI is above the top guide and crosses below the signal line a sell signal will be generated. Conversely, if the SMI is below the bottom guide and crosses above the signal line a buy signal will be given. The 0 line divides the bulls (above) from the bears (below).
How To Access in MotiveWave
Go to the top menu, choose Study>Oscillators>SMI Ergodic Indicator
or go to the top menu, choose Add Study, start typing in this study name until you see it appear in the list, click on the study name, click OK.
Important Disclaimer: The information provided on this page is strictly for informational purposes and is not to be construed as advice or solicitation to buy or sell any security. Please see our Risk Disclosure and Performance Disclaimer Statement.
Calculation
//price (user defined, default is closing price)
//method = moving average (user defined, default is EMA)
//prevP = previousPrice
//abs = absolute value
//ma = moving average, index = current bar number
//MT = moreThan
//LT = lessThan
prevP = price[index-1];
change = price - prevP;
absChange = abs(price - prevP);
tempChange = ma(method, index, fastPeriod, change);
tempAbsC = ma(method, index, fastPeriod, absChange);
tempChange = ma(method, index, slowPeriod, tempChange);
tempAbsC = ma(method, index, slowPeriod, tempAbsC);
Plot1: SMI = tempChange / tempAbsC;
Plot2: SIGNAL = ma(method, index, sigPeriod, SMI);
//Signals
highSell = smi for last sell signal, reset to max_negative at each  buy signal;
lowBuy = smi for last buy signal, reset to max_positive at each sell signal;
sell=crossedBelow(SMI, SIGNAL) AND smi MT topGuide  AND smi MT highSell;
buy=crossedAbove(SMI, SIGNAL) AND smi LT bottomGuide AND smi LT lowBuy;