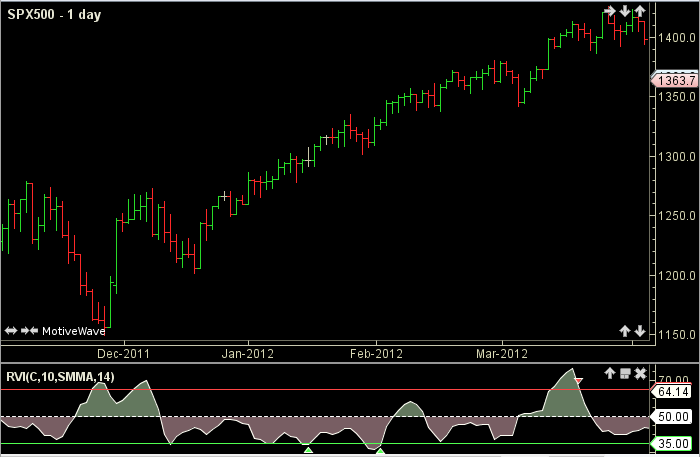
Relative Volatility Index
The Relative Volatility Index (RVI) by Donald Dorsey is a confirming indicator that measures the direction of volatility. The RVI is similiar to the Relative Strength Index (RSI) except instead of daily price change standard deviation is used. Adjustable guides are given to fine tune the trading signals. The user may change the input (close), method (SMMA), period lengths and guide values. This indicator’s definition is further expressed in the condensed code given in the calculation below.
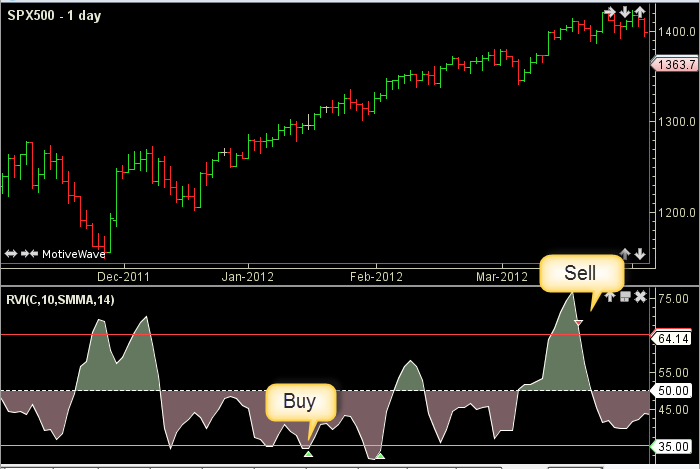
How To Trade Using the Relative Volatility Index
Adjust the top and bottom guides to control the quantity and quality of the trading signals. RVI values above 70 to 80 are considered to be overbought and therefore offer an opportunity to sell. RVI values below 30 to 20 are considered oversold and present an opportunity to buy. In addition to the guides, if the RVI peaks while above the top guide a sell signal will be generated. Conversely, if the RVI troughs below the bottom guide a buy signal will be given. The 50 line divides the bulls (above) from the bears (below).
How To Access in MotiveWave
Go to the top menu, choose Study>Oscillators>Relative Volatility Index
or go to the top menu, choose Add Study, start typing in this study name until you see it appear in the list, click on the study name, click OK.
Important Disclaimer: The information provided on this page is strictly for informational purposes and is not to be construed as advice or solicitation to buy or sell any security. Please see our Risk Disclosure and Performance Disclaimer Statement.
Calculation
//input = price, user defined, default is closing price
//method = moving average, user defined, default is SMMA
//smoothPeriod = user defined, default is 14
//sdPeriod = user defined, default is 10
//method = moving average, user defined, default is SMMA
//standDev = standard deviation
//diff = difference
//MT = more than
//LT = less than
//ma = moving average, index = current bar number
standDev = std(index, sdPeriod, input);
diff = standDev - standDev[index-1];
if (diff mT; 0) up = diff
else down = diff
avgUp = ma(method, index, smoothPeriod, up);
avgDown = ma(method, index, smoothPeriod, down);
rs = avgUp / avgDown;
Plot: RVI = 100 - ( 100 / (1 + rs));
//Signals
highSell = rvi for last sell signal, reset to max_negative at each  buy signal;
lowBuy = rvi for last buy signal, reset to max_positive at each sell signal;
sell = (rvi MT topGuide) AND (prevRvi MT rvi)  AND (rvi MT highSell);
buy = (rvi LT bottomGuide AND prevRvi LT rvi) AND (rvi LT lowBuy);