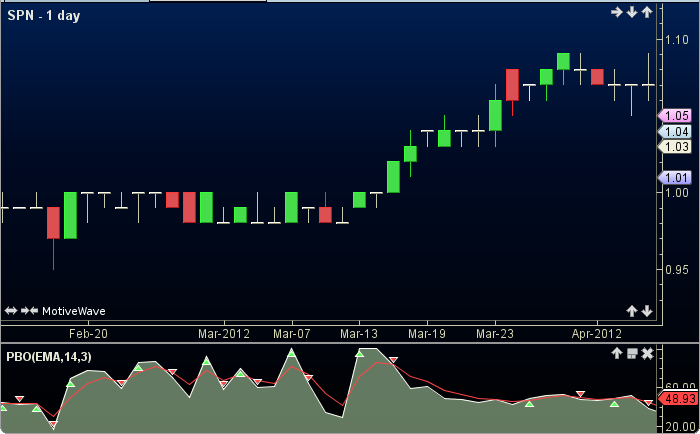
Projection Oscillator
The Projection Oscillator (PO) was authored by Mel Widner, Stocks and Commodities Mag. 07/1995. The PO uses the Linear Regression slope, along with highs and lows in its calculation. The user may change the method (EMA) and period lengths. This indicator’s definition is further expressed in the condensed code given in the calculation below.
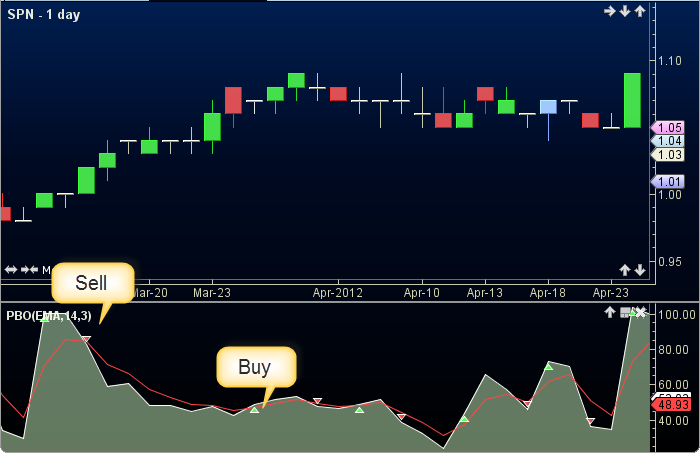
How To Trade Using Projection Oscillator
Trading signals are given when thr pbo crosses the signal line. If the pbo crosses above (upward movement) a buy signal will be generated. Conversely, if the pbo crosses below (downward movement) a sell signal will be given.
How To Access in MotiveWave
Go to the top menu, choose Study>Mel Widner>Projection Oscillator
or go to the top menu, choose Add Study, start typing in this study name until you see it appear in the list, click on the study name, click OK.
Important Disclaimer: The information provided on this page is strictly for informational purposes and is not to be construed as advice or solicitation to buy or sell any security. Please see our Risk Disclosure and Performance Disclaimer Statement.
Calculation
//method = user defined, default is EMA
//pboPeriod = user defined, default is 14
//sigPeriod = user defined, default is 3
//index = current bar number, LOE = less or equal
mHigh = linRegLine(period, high)[1];   //returns the slope (m) of Linear Regresion line
mLow = linRegLine( period, low)[1];
count = 0;
pbw = 0, pu = 0, pl = Double.MAX_VALUE;
for (i = (index-pboPeriod + 1); i LOE index; i++)   //move back 1 period
    high = high[i];
    low = low[i];
    vHigh = high + (mHigh * (count));
    vLow = low + (mLow * (count));
    if (vHigh moreThan pu) pu = vHigh;
    if (vLow lessThan pl) pl = vLow;
    count++;
endFor
Plot1: PBO = 100 * (price - pl) / (pu - pl);
Plot2: SIG = ma(method, sigPeriod, pbo);
buy = crossedAbove(PBO, SIG);
sell = crossedBelow(PBO, SIG);