Pivot Point Average
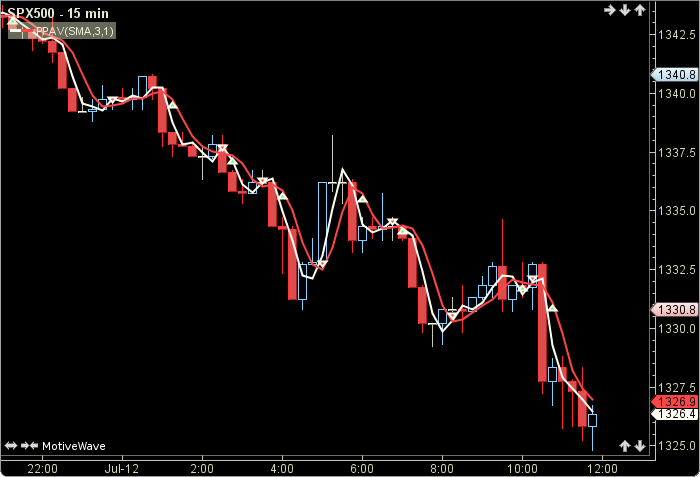
Pivot Point (PP) and Pivot Point Average (PPA) was authored by Jayanthi Gopalakrisshan in the Stocks and Commodities Magazine 02/2000. The PP is calculated from different combinations of current and previous, highs, lows, opens and closes. The paticular combination is dependant upon a user input called price method. The signal line is the (PPA) which is a moving average of the PP. The user may change the method (SMA), period length and price method. This indicator’s definition is further expressed in the condensed code given in the calculation below.
How To Trade Using Pivot Point Average
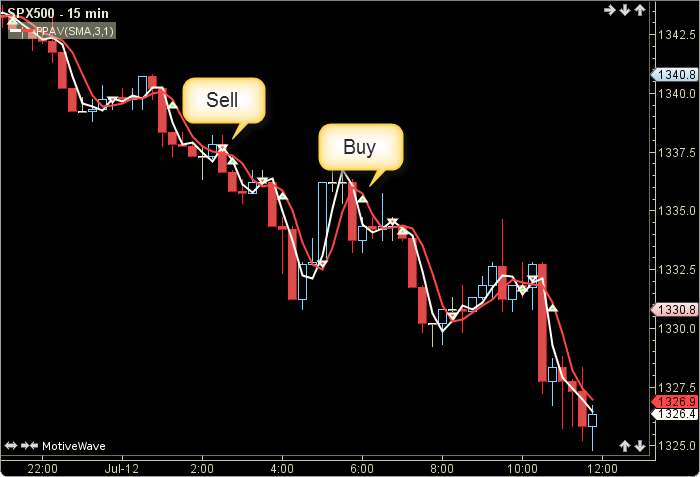
If the PP crosses below the PPAV a sell signal will be generated. Conversely, if the PP crosses above the PPAV a buy signal will be given.
How To Access in MotiveWave
Go to the top menu, choose Study>Overlays>>Pivot Point Average
or go to the top menu, choose Add Study, start typing in this study name until you see it appear in the list, click on the study name, click OK.
Important Disclaimer: The information provided on this page is strictly for informational purposes and is not to be construed as advice or solicitation to buy or sell any security. Please see our Risk Disclosure and Performance Disclaimer Statement.
Calculation
//method = moving average, user defined, default is SMA
//period = user defined, default is 3
//priceM = price Method, user defined, default is 1
//prev = previous, index = current bar number
prevH = high[index-1];
prevL = low[index-1];
prevC = close[index-1];
pp = (prevH + prevL + prevC) / 3;
if (priceM == 1) pp = (prevH + prevL + prevC) / 3;
if (priceM == 2) pp = (prevH + prevL + prevC + open) / 4;
if (priceM == 3) pp = (prevH + prevL + open) / 3;
plot1: pp;
plot2: ppav = ma(method, period, pp);
//Signals
sell = crossedAbove(PP, PPAV);
buy = crossedBelow(PP, PPAV);