Percentage Volume Oscillator
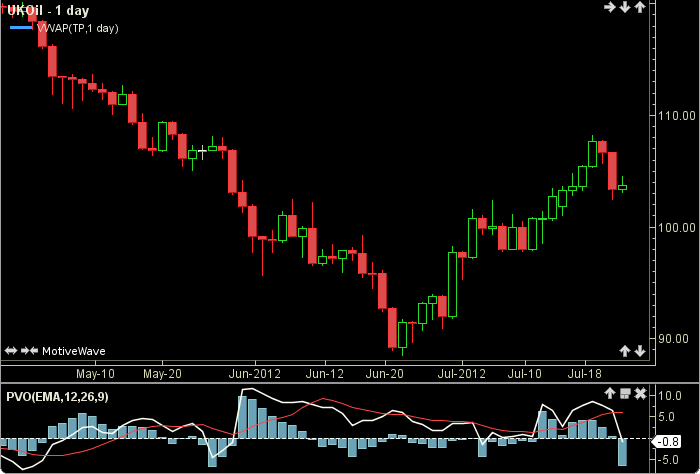
The Percentage Volume Oscillator (PVO) shows the percentage difference between two moving averages of volume. This study takes three different periods. The first two define the two moving averages that are being compared. The last period is used to smooth the difference and form the signal line. A histogram of their difference (PVO minus signal) is also given. The user may change the inputs (EMA, SMA) and period lengths. This indicator’s definition is further expressed in the condensed code given in the calculation below.
How To Trade Using Percentage Volume Oscillator
No trading signals are calculated for this indicator.
How To Access in MotiveWave
Go to the top menu, choose Study>Volume Based>Percentage Volume Oscillator
or go to the top menu, choose Add Study, start typing in this study name until you see it appear in the list, click on the study name, click OK.
Important Disclaimer: The information provided on this page is strictly for informational purposes and is not to be construed as advice or solicitation to buy or sell any security. Please see our Risk Disclosure and Performance Disclaimer Statement.
Calculation
//method1 = moving average (ma), user defined, default is EMA
//method2 = moving average (ma), user defined, default is SMA
//period1 = user defined, default is 12
//period2 = user defined, default is 26
//signalPeriod = user defined, default is 9
//index = current bar number
MA1 = ma(method1, index, period1, VOLUME);
MA2 = ma(method1, index, period2, VOLUME);
Plot1: PVO = ((MA1 - MA2)/MA2) * 100;
//Calculate moving average of PVO (signal line)
Plot2: signal = ma(method2, index, signalPeriod, PVO);
PlotHist3: hist = PVO - signal;