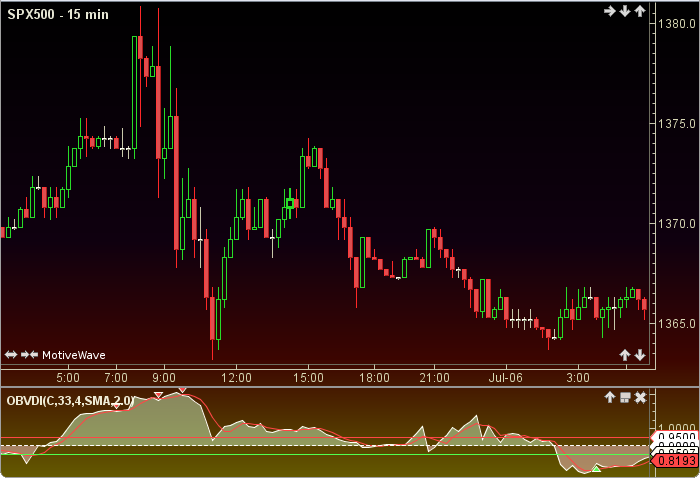
OnBalance Volume Disparity Indicator
OnBalance Volume Disparity Indicator is authored by Phillip C. Holt, Stocks and Commodities Mag. 06/1996. Volume is not considered, but OnBalance uses Bollinger Band® differences in two time periods to orchestrate its oscillator value. Adjustable guides and a signal line are given to fine tune the trading signals. The user may change the input (close), method (SMA), period lengths, standard deviation factor and guide values. This indicator’s definition is further expressed in the condensed code given in the calculation below.
How To Trade Using OnBalance Volume Disparity Ind
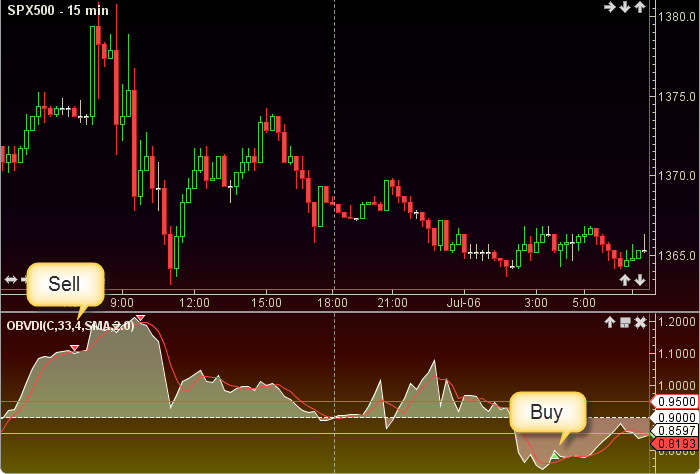
Adjust the top and bottom guides to control the quantity and quality of the trading signals. If the OBVDI is above the top guide and crosses below the AV a sell signal will be generated. Conversely, if the OBVDI is below the bottom guide and crosses above the AV a buy signal will be given. The .9 line divides the bulls (above) from the bears (below).
How To Access in MotiveWave
Go to the top menu, choose Study>Volume Based>OnBalance Volume Disparity Ind
or go to the top menu, choose Add Study, start typing in this study name until you see it appear in the list, click on the study name, click OK.
Important Disclaimer: The information provided on this page is strictly for informational purposes and is not to be construed as advice or solicitation to buy or sell any security. Please see our Risk Disclosure and Performance Disclaimer Statement.
Calculation
//input = price, user defined, default is closing price
//period1 = user defined, default is 33
//period2 = user defined, default is 4
//method = user defined, default is SMA
//noStd = user defined, default is 2 // number of standard deviations
//av = average, ma = moving average
//bb = bollinger bands, bb[0] = top, bb[1] = bottom
//index = current bar number
bb[] = bollingerBands(index, period1, noStd, noStd, input);
bbDiff = bb[0] - bb[1];
perb = 0;
if (bbDiff != 0) perb = (price - bb[1])/ (bbDiff);
obv[] = bollingerBands(index, period1, noStd, noStd, perb);
bbDiff = obv[0] - obv[1];
obvPerb = 0;
if (bbDiff != 0) obvPerb = (perb - obv[1])/ (bbDiff);
plot1: obvDi = (1 + perb) / (1 + obvPerb);
plot2: av = ma(method, index, period2, obvDi);
//Signals
highSell = obvDi for last sell signal, reset to max_negative at each  buy signal;
lowBuy = obvDi for last buy signal, reset to max_positive at each sell signal;
sell = crossedBelow(OBVDI, AV) AND (obvDi moreThan topGuide) AND (obvDi moreThan highSell);
buy = crossedAbove(OBVDI, AV) AND (obvDi lessThan bottomGuide) AND (obvDi lessThan lowBuy);