OC Histogram
The author of the OC Histogram is unknown. The Opening Closing Histogram is the difference of 2 exponential moving averages. The user may change the method (EMA), input1 (close), input2 (open) and period lengths. This indicator’s definition is further expressed in the condensed code given in the calculation below.
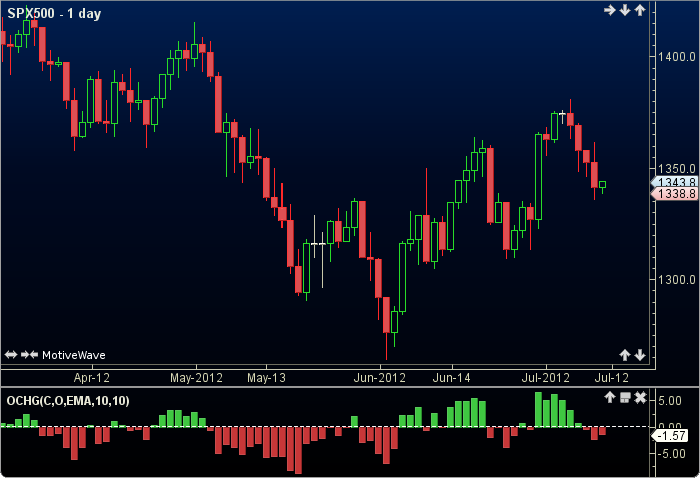
How To Trade Using OC Histogram
The OC Histogram is a trending indicator and may be used in conjunction with other studies. Values below the zero line indicate a downward trend. Conversely, values above represent an upward trend. No trading signals are calculated for this indicator.
How To Access in MotiveWave
Go to the top menu, choose Study>Oscillaors>OC Histogram
or go to the top menu, choose Add Study, start typing in this study name until you see it appear in the list, click on the study name, click OK.
Important Disclaimer: The information provided on this page is strictly for informational purposes and is not to be construed as advice or solicitation to buy or sell any security. Please see our Risk Disclosure and Performance Disclaimer Statement.
Calculation
//input1 = price, user defined, default is closing price
//input2 = price, user defined, default is opening price
//method = moving average (ma), user defined, default is EMA
//period1 = user defined, default is 10
//period2 = user defined, default is 10
//index = current bar number
ma1 = ma(method, index, period1, input1);
ma2 = ma(method, index, period2, input2);
PlotHist: oc = ma1 - ma2;