Keltner Channel
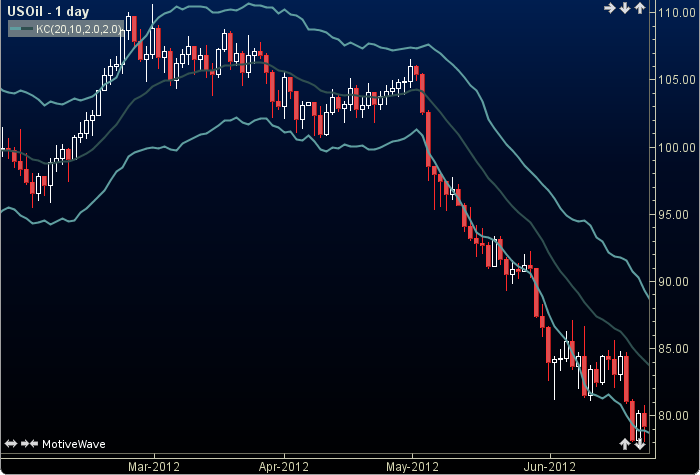
The Keltner Channel is named after Chester W. Keltner. In this modern version of the Keltner Channel, the middle line is an exponential moving average (EMA) of the given input. The upper and lower bands are a set distance that is a multiple (range attribute) of Average True Range from the middle line. The user may change the input (close), period lengths and range attributes. This indicator’s definition is further expressed in the condensed code given in the calculation below.
Click here for more information.
How To Trade Using Kelter Channel
No trading signals are currently calculated for Keltner Channel.
How To Access in MotiveWave
Go to the top menu, choose Study>Overlays>Keltner Channel
or go to the top menu, choose Add Study, start typing in this study name until you see it appear in the list, click on the study name, click OK.
Important Disclaimer: The information provided on this page is strictly for informational purposes and is not to be construed as advice or solicitation to buy or sell any security. Please see our Risk Disclosure and Performance Disclaimer Statement.
Calculation
//input = price, user defined, default is close
//middlePeriod= user defined, default is 20
//atrPeriod= user defined, default is 10
//upperRange = user defined, default is 2
//lowerRange = user defined, default is 2
//ma = moving average, EMA = exponential moving average
//index = current bar number, atr = average true range
atr = atr(index, atrPeriod);
Plot2: ma = ma("EMA", index, middlePeriod, input);
Plot1: ma + (upperRange * atr);
Plot3: ma - (upperRange * atr);