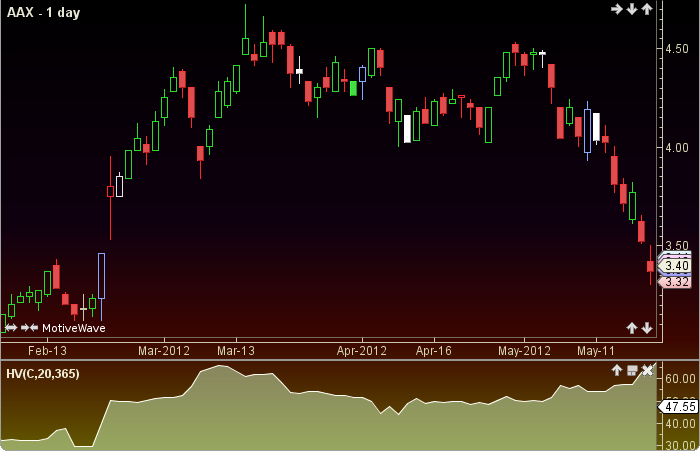
Historical Volatility
Historical Volatility and pattern recognition was authored by Laurence A. Conners and Linda Bradford Raschke, Stocks and Commodities Mag. 08/1996. It uses standard deviation and natural logarithm in its formula. The user may change the input (close), period and annual length. This indicator’s definition is further expressed in the condensed code given in the calculation below.
How To Trade Using Historical Volatility
Historical Volatility may to be used in conjunction with other indicators. No trading signals are given.
How To Access in MotiveWave
Go to the top menu, choose Study>General>Historical Volatility
or go to the top menu, choose Add Study, start typing in this study name until you see it appear in the list, click on the study name, click OK.
Important Disclaimer: The information provided on this page is strictly for informational purposes and is not to be construed as advice or solicitation to buy or sell any security. Please see our Risk Disclosure and Performance Disclaimer Statement.
Calculation
//input = price, user defined, default is close
//period = user defined, default is 20
// annual = user defined, default is 365
//prev = previous
//log = natural logarithm
//std = standard deviation
//sqrt = square root
//index = current bar number
value = price[index];
prevValue = price[index-1];
temp = log(value/prevValue);
Plot: hv = 100 * std(period, temp) * sqrt(annual);