Fast And Slow Kurtosis
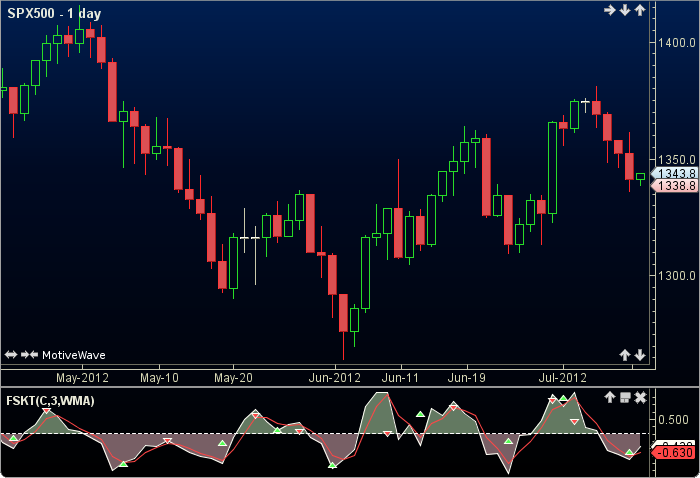
Fast And Slow Kurtosis (FSK) was authored by U. Jenson for Omega Research. The FSK uses Momentum, previous Momentum and previous FSK (feedback) along with a percentage factor to plot its value. A signal line, which is an weighted moving average of itself, is also given. The user may change the input (close), method (WMA) and period length. This indicator’s definition is further expressed in the condensed code given in the calculation below.
How To Trade Using Fast And Slow Kurtosis
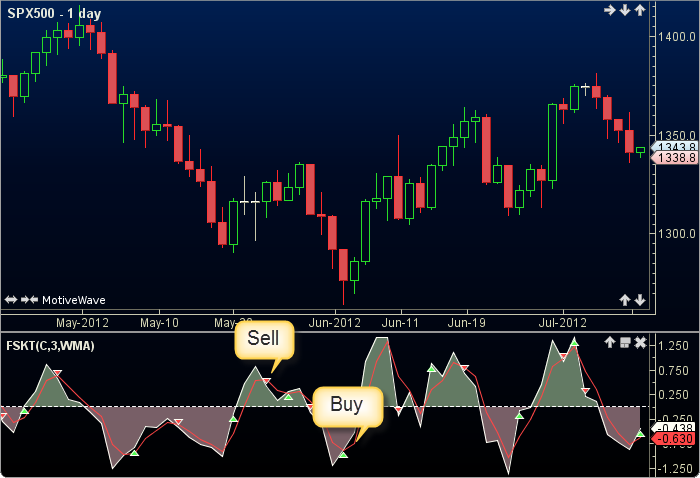
If the FSK crosses below the signal line a sell signal will be generated. Conversely, if the FSK crosses above the signal line a buy signal will be given.
How To Access in MotiveWave
Go to the top menu, choose Study>Oscillators>Fast&Slow Kurtosis
or go to the top menu, choose Add Study, start typing in this study name until you see it appear in the list, click on the study name, click OK.
Important Disclaimer: The information provided on this page is strictly for informational purposes and is not to be construed as advice or solicitation to buy or sell any security. Please see our Risk Disclosure and Performance Disclaimer Statement.
Calculation
//input = price (user defined, default is closing price)
//method = moving average (user defined, default is WMA)
//period = user defined, default is 3
//prev = previous, index = current bar number
mom = momentum(index, period, input);
prevMom = mon[index-1];
prevFsk = FSK[index-1];
Plot1: fsk = (.03 * (mom - prevMom)) + ((1 - .03) * prevFsk);
Plot2: sig = ma(method, index, period, fsk);
//Signals
highSell = fsk for last sell signal, reset to max_negative at each  buy signal;
lowBuy = fsk for last buy signal, reset to max_positive at each sell signal;
buy = crossedAbove(FSK, SIG);
sell = crossedBelow(FSK, SIG);