Dynamic Momentum Index
The Dynamic Momentum Index by Tushar Chande and Stanley Kroll, Stocks and Commodities Mag. 05/1993, is similar to the Relative Strength Index (RSI) except with a variable length period. The user defined RSI period may be modified (within limits) with the average Standard Deviation value. Signals and adjustable guides are given. The user may change the input (close), period lengths, limits and guide values. This indicator’s definition is further expressed in the condensed code given in the calculation below.
How To Trade Using Dynamic Momentum Index
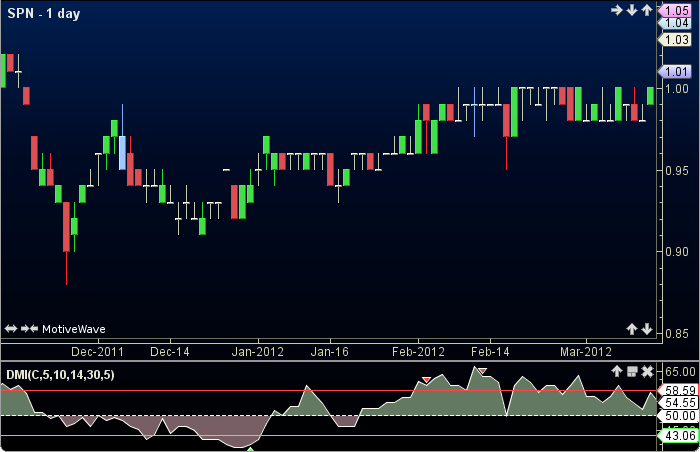
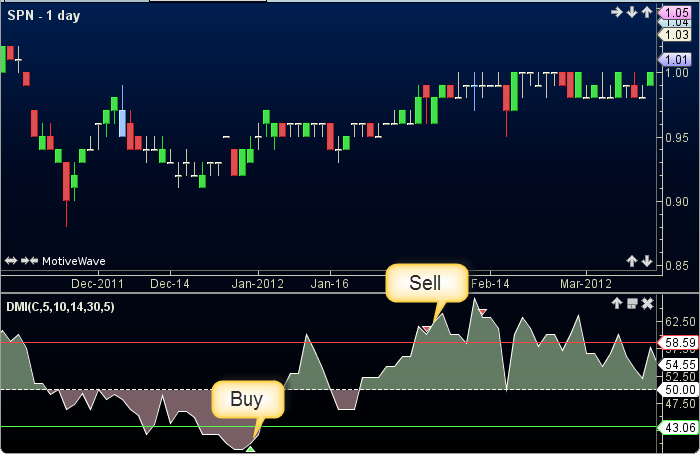
Adjust the top and bottom guides to control the quantity and quality of the trading signals. If the dmi peaks above the top guide a sell signal will be generated. Conversely, if the dmi troughs below the bottom guide a buy signal will be given. The 50 line divides the bulls (above) from the bears (below).
How To Access in MotiveWave
Go to the top menu, choose Study>Tushar Chande>Dynamic Momentum Index
or go to the top menu, choose Add Study, start typing in this study name until you see it appear in the list, click on the study name, click OK.
Important Disclaimer: The information provided on this page is strictly for informational purposes and is not to be construed as advice or solicitation to buy or sell any security. Please see our Risk Disclosure and Performance Disclaimer Statement.
Calculation
//input = price, user defined, default is close
//sdPeriod = user defined, default is 5
//avSdPeriod = user defined, default is 10
//rsiPeriod = user defined, default is 14
//upLimit = user defined, default is 30
//loLimit = user defined, default is 5
//stdDev = std = standard deviation
//av = average, prev = previous
//rsi = Relative Strength Index
//sma = simple moving average, index = current bar number
stdDev = std(index, sdPeriod, input);
avSd = sma(index, avSdPeriod, stdDev);
dTime = round(rsiPeriod / avSd); //period dependent on average of stdDev
lenDmi = max(min(dTime, upLimit), loLimit);  //determine period length
Plot: dmi = rsi(lenDmi, input)[0];
 //Signals
prevDmi = dmi[index-1];
highSell = dmi for last sell signal, reset to max_negative at each  buy signal;
lowBuy = dmi for last buy signal, reset to max_positive at each sell signal;
sell = (dmi moreThan topGuide) AND (prevDmi moreThan dmi  AND (dmi moreThan highSell);
buy = (dmi lessThan bottGuide AND prevDmi lessThan dmi AND (dmi lessThan lowBuy);