Double Smooth Stochastic
The Double Smooth Stochastic by William Blau is a version of a stochastic oscillator first promoted by Dr. George Lane in the 1950′s. In this version of stochastics the numerator (close – period low) and the denominator (period high - period low) are separately, doubly smoothed, with EMA’s and the quotient multiplied by 100. A signal line (SDSS), which is an EMA of the Double Smoothed Stochastic (DSS), is plotted to help trigger buy and sell signals. Adjustable guides are also given to fine tune the signals. The user may change the input (close), method (EMA), period lengths and guide values. This indicator’s definition is further expressed in the condensed code given in the calculation below.
Click here for more information on the Stochastic Oscillator
How To Trade Using Double Smooth Stochastic
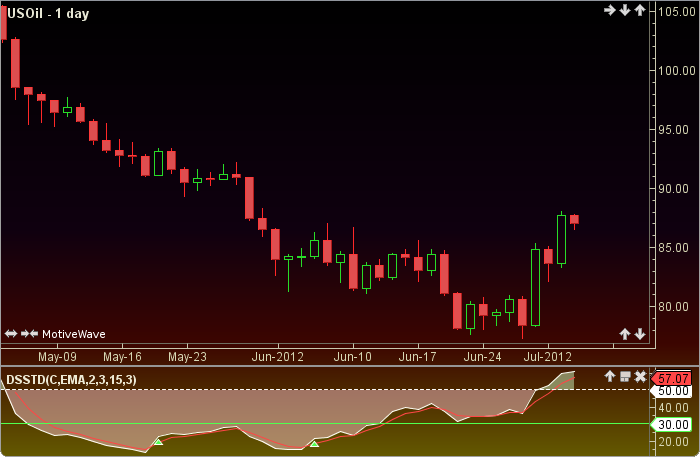
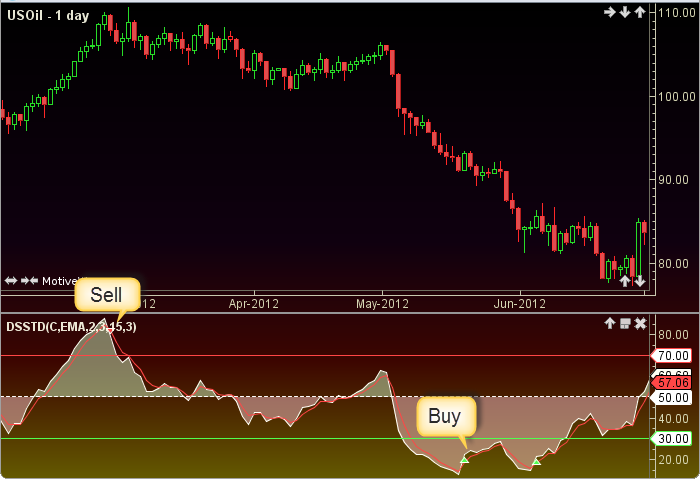
Adjust the top and bottom guides to control the quantity and quality of the trading signals. DSS values above 70 to 80 are considered to be overbought and therefore offer an opportunity to sell. DSS values below 30 to 20 are considered oversold and present an opportunity to buy. In addition to the guides, if the DSS crosses the signal line a change in trend is predicted. If the DSS is above the top guide and crosses below the signal line a sell signal will be generated. Conversely, if the DSS is below the bottom guide and crosses above the signal line a buy signal will be given. The 50 line divides the bulls above from the bears below.
How To Access in MotiveWave
Go to the top menu, choose Study>William Blau>Double Smooth Stochastic
or go to the top menu, choose Add Study, start typing in this study name until you see it appear in the list, click on the study name, click OK.
Important Disclaimer: The information provided on this page is strictly for informational purposes and is not to be construed as advice or solicitation to buy or sell any security. Please see our Risk Disclosure and Performance Disclaimer Statement.
Calculation
//input = price, user defined, default is closing price
//method = moving average, user defined, default is EMA
//kPeriod = user defined, default is 2
//ssPeriod = user defined, default is 3
//dsPeriod = user defined, default is 15
//sdsPeriod = user defined, default is 3
//num = numerator
//den = denomator
//ss = single smoothed
//ds = double smoothed
//dss = double smoothed stochastic
//sdss = signal for double smoothed stochastic
//index = current bar number
if (HighLow)
    lowest = lowest(index, kPeriod, Low);
    highest = highest(index, kPeriod, High);
else
    lowest = lowest(index, kPeriod, input);
    highest = highest(index, kPeriod, input);
end
num = input - lowest;
den = highest - lowest;
ssNum = ma(method, index, ssPeriod, num);
ssDen = ma(method, index, ssPeriod, den);
dsNum = ma(method, index, dsPeriod, ssNum);
dsDen = ma(method, index, dsPeriod, ssDen);
Plot1: DSS = 100 * dsNum / dsDen;
Plot2: SDSS = ma(method, index, sdsPeriod, DSS);
//Signals
highSell = dss for last sell signal, reset to max_negative at each  buy signal;
lowBuy = dss for last buy signal, reset to max_positive at each sell signal;
sell = crossedBelow(DSS, SDSS) AND dss moreThan topGuide AND dss moreThan highSell;
buy = crossedAbove(DSS, SDSS) AND dss lessThan bottomGuide AND dss lessThan lowBuy;