DEMA 2 Lines
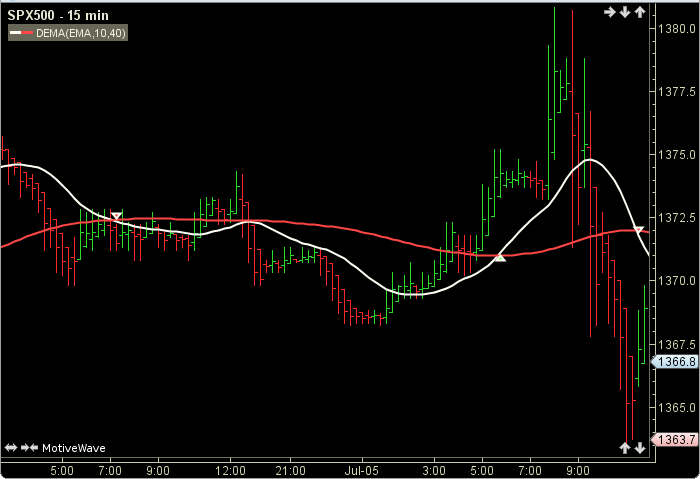
DEMA 2Lines by Bill Mars displays two doubly smoothed, exponential moving averages. When the two averages cross trading signals are triggered. The user may change the method (EMA) and period lengths. This indicator’s definition is further expressed in the condensed code given in the calculation below.
How To Trade Using DEMA 2Lines
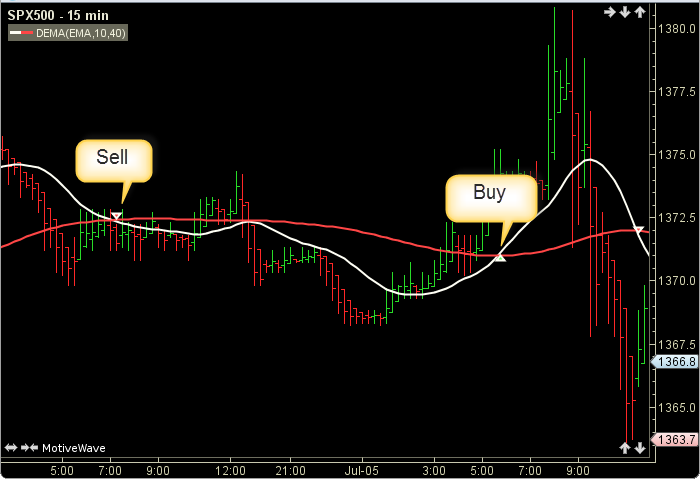
Trading signals are generated when the DEMA1 and the DEMA2 cross. If the DEMA1 crosses above (upward movement) a buy signal is generated. Conversely, if the DEMA1 crosses below (downward movement) a sell signal is given.
How To Access in MotiveWave
Choose Study -> Add Study from the top menu bar, start typing in this study name until you see it appear in the list, click on the study name, click OK.
Important Disclaimer: The information provided on this page is strictly for informational purposes and is not to be construed as advice or solicitation to buy or sell any security. Please see our Risk Disclosure and Performance Disclaimer Statement.
Calculation
//method = moving average(ma), user defined, default is EMA
//period1 = user defined, default = 10
//period2 = user defined, default = 40
//ema = expotential moving average
price = (high + low) / 2;
ema1 = ma(method, period1, price);
ema2 = ma(method, period2, price);
Plot1: dema1 = ma(method, period1, ema1);
Plot2: dema2 = ma(method, period2, ema2);
//Signals
buy = crossedAbove(DEMA1, DEMA2);
sell = crossedBelow(DEMA1, DEMA2);