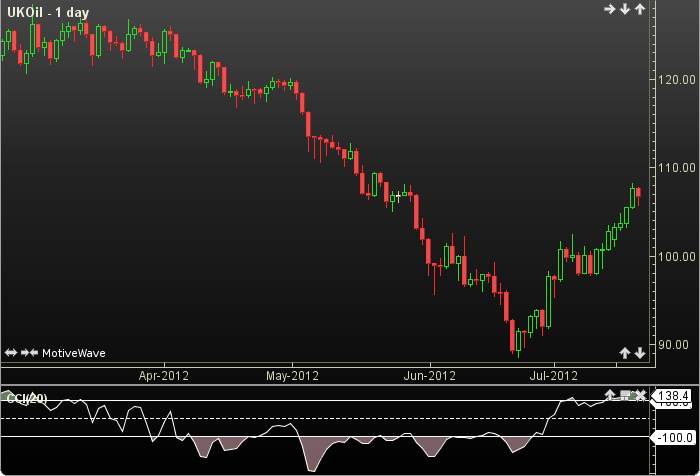
Commodity Channel Index
The Commodity Channel Index (CCI) was originally introduced by Donald Lambert in 1980. The CCI is designed to identify cyclical turns in commodities. It assumes that commodities move in cycles, with highs and lows coming at periodic intervals. It is recommended to use 1/3 of a complete cycle as a time frame (IE: for a 60 day cycle use 20 day CCI). The user may change only the period length. This indicator’s definition is further expressed in the condensed code given in the calculation below.
Click here for more information.
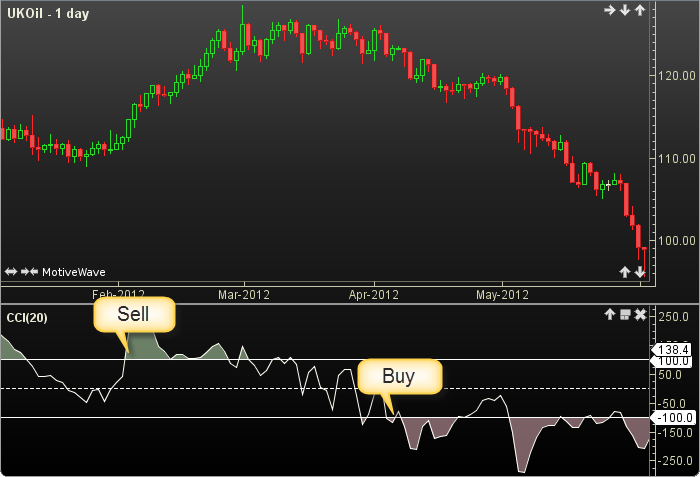
How To Trade Using Commodity Channel Index
Adjust the top and bottom guides to control the quantity and quality of the trading signals. If the CCI crosses above the top guide a sell signal will be generated, Conversely, if the CCI crosses below the bottom guide a buy signal will be given.
How To Access in MotiveWave
Go to the top menu, choose Study>General>Commodity Channel Index
or go to the top menu, choose Add Study, start typing in this study name until you see it appear in the list, click on the study name, click OK.
Important Disclaimer: The information provided on this page is strictly for informational purposes and is not to be construed as advice or solicitation to buy or sell any security. Please see our Risk Disclosure and Performance Disclaimer Statement.
Calculation
//period = user defined, default is 20
//LT = less than, LOR= = less or equal
//index = current bar number
TP[] = new [period];
j = 0;
sum = 0;
for(int i = index-period+1; i LOR= index; i++)
      TP[j] = getTypicalPrice(i);
      sum += TP[j];
      j++;
endFor
SMATP = sum / period;
// Calculate the Mean Deviation
sum = 0;
for(int i = 0; i LT TP.length; i++)
      sum += Math.abs(TP[i]-SMATP);
endFor
MD = sum / period;
Plot: CCI = (TP[period-1] - SMATP) / (.015*MD);
//Signals
buy = crossedAbove(CCI, topGuide);
sell = crossedBelow(CCI, bottomGuide);