Chandelier Exits
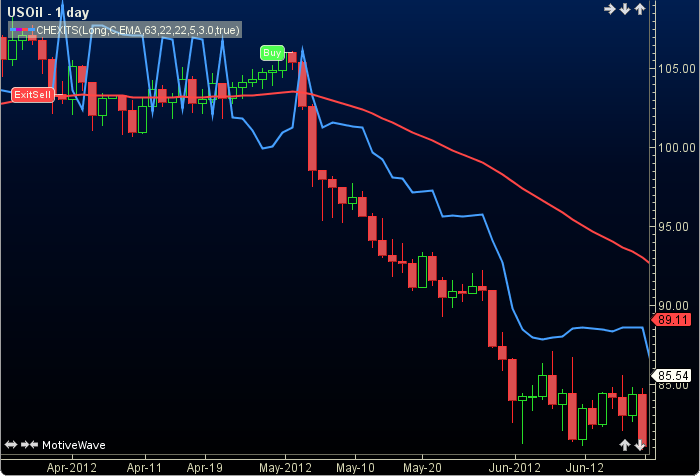
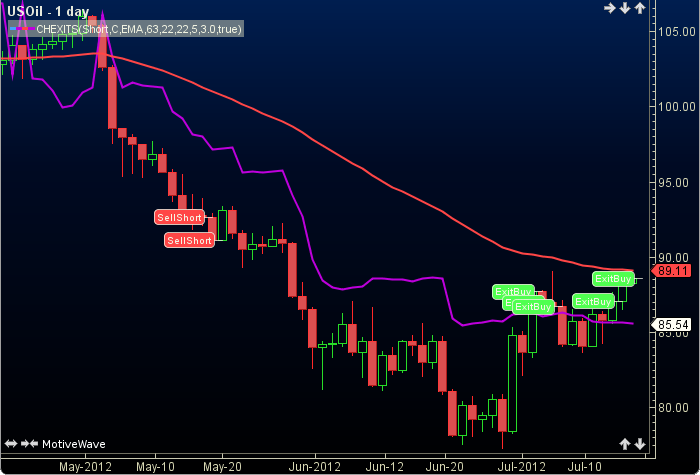
Chandelier Exits (CE) was authored, by Chuck LeBeau. CE identifies stop loss exit points for long or short positions. Optional entry points are also displayed. CE uses an exponential moving average to determine the current trend; then the average true range times a user defined factor is either, depending upon the trend, added or subtracted from the highest high or lowest low. The user may change the position (long), input (close), method (EMA), period lengths, look back, factor and show entry option. This indicator’s definition is further expressed in the condensed code given in the calculation below.
How To Trade Using Chandelier Exits
Chandelier Exits are designed to aid in stop loss exit decisions. However entry points are optionally provided. These are based on five consecutive increases in an uptrend (buy) or five consecutive decreases in a down trend (sell).
How To Access in MotiveWave
Go to the top menu, choose Study>Exits>Chandelier Exits Stops
or go to the top menu, choose Add Study, start typing in this study name until you see it appear in the list, click on the study name, click OK.
Important Disclaimer: The information provided on this page is strictly for informational purposes and is not to be construed as advice or solicitation to buy or sell any security. Please see our Risk Disclosure and Performance Disclaimer Statement.
Calculation
//position = pos, user defined, default is long
//input = price, user defined, default is close
//method = moving average (ma), user defined, default is EMA
//period1 = maP, user defined, default is 63
//period2 = upP, user defined, default is 22
//period3 = dnP, user defined, default is 22
//look back = lb, user defined, default is 5
//factor = fac, user defined, default is 3
//show entry = showE, user defined boolean, default is false
//index = current bar number, prev = previous
//shortP = short position, longP = long position
//index = current bar number
ma = ma(method, index, maP, key);
prevP = price[index-1];
upTrend = price moreThan ma;
dnTrend = price lessThan ma;
if (upTrend)
    atrUp = atr(index, upP);
    highest = highest(index, upP, HIGH);
    chand = highest - fac * atrUp;
endIf
if (dnTrend)
    atrDn = atr(index, dnP);
    lowest = lowest(index, dnP, LOW);
    chand = lowest + fac * atrDn;
endIf
Plot: chand;
//Signals
lowFive = false;
for (i = -(lb-1); i lessOr=0; i++)
    cP = price[index+i];
    prevP = price[index+i-1];
    cMa = MA[index+i];
    pMa = MA[index+i-1];
    lowFive =  (cP lessThan prevP AND cP lessThan cMa AND prevP lessThan pMa);
    if (!lowFive) break;
endFor
highFive = false;
for (i = -(lb-1); i lessOr=0; i++)
    cP = price[index+i];
    prevP = price[index+i-1];
    cMa = MA[index+i];
    pMa = MA[index+i-1];
    highFive =  (cP moreThan prevP AND cP moreThan cMa AND prevP moreThan pMa);
    if (!highFive) break;
endFor
sell = false, buy = false;
if (chand != 0)
    if (longP AND upTrend)
        sell = prevP moreThan chand AND price lessThan chand;  //sell to exit
        buy = highFive AND showE; //buy
    endif
    if (shortP AND dnTrend)
        sell = lowFive AND showE; //sell short
        buy = prevP lessThan chand AND price moreThan chand; //buy to cover
    endIf
endIf