Fisher Transform Stochastic Oscillator
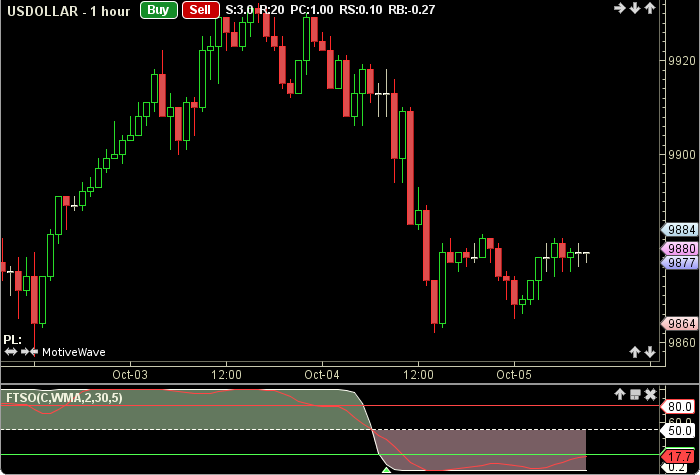
The Fisher Transform Stochastic Oscillator was authored by Sylvain Vervoort in the Stocks and Commodities Magazine, Oct 2011. The oscillator is formed first from a multi-layered Weighted Moving Average, which is then used as the base for the Stochastic calculation. This value (RBWS) is then plied with factors and constants to produce the oscillator (FTSO). The user may change the input (close), method (WMA), period lengths and guide values. This indicator’s definition is further expressed in the condensed code given in the calculation below.
How To Trade Using the Fisher Transform Stochastic Oscillator
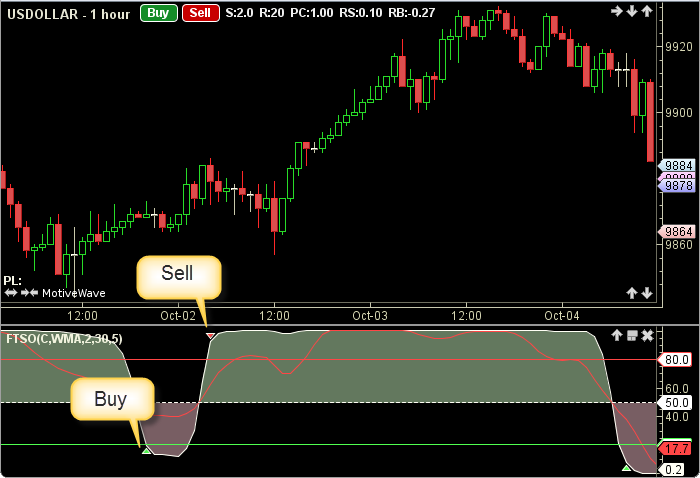
Adjust the top and bottom guides to control the quantity and quality of the trading signals. FTSO values above 70 to 80 are considered to be overbought and therefore offer an opportunity to sell. FTSO values below 30 to 20 are considered oversold and present an opportunity to buy. If the FTSO crosses above the top guide a sell signal will be generated. Conversely, if the FTSO crosses below the bottom guide a buy signal will be given. The 50 line divides the bulls above from the bears below
How To Access in MotiveWave
Go to the top menu, choose Study>Oscillarors>Fisher Transform Stochastic Oscillator
or go to the top menu, choose Add Study, start typing in this study name until you see it appear in the list, click on the study name, click OK.
Important Disclaimer: The information provided on this page is strictly for informational purposes and is not to be construed as advice or solicitation to buy or sell any security. Please see our Risk Disclosure and Performance Disclaimer Statement.
Calculation
//input = price, user defined, default is closing price
//method = moving average (ma), user defined, default is WMA
//averagePeriod = user defined, default is 2
//stochasticPeriod = user defined, default is 30
//smoothPeriod = user defined, default is 5
//index = current bar number
ma1 = ma(method, index, averagePeriod, price);
rbw = ma1 * 5;
ma2 = ma(method, index, averagePeriod, MA1);
rbw = rbw + ma2 * 4;
ma3 = ma(method, index, averagePeriod, MA2);
rbw = rbw + ma3 * 3;
ma4 = ma(method, index, averagePeriod, MA3);
rbw = rbw + ma4 * 2;
ma5 = ma(method, index, averagePeriod, MA4);
rbw = rbw + ma5;
ma6 = ma(method, index, averagePeriod, MA5);
rbw = rbw + ma6;
ma7 = ma(method, index, averagePeriod, MA6);
rbw = rbw + ma7;
ma8 = ma(method, index, averagePeriod, MA7);
rbw = rbw + ma8;
ma9 = ma(method, index, averagePeriod, MA8);
rbw = rbw + ma9;
ma10 = ma(method, index, averagePeriod, MA9);
rbw = (rbw + ma10) / 20;

//Stochastic Calculation
lowest = lowest(index, stochasticPeriod, RBW);
highest = highest(index, stochasticPeriod, RBW);
num = rbw - lowest;
den = highest - lowest;
num = sum(index, smoothPeriod, NUM);
den = sum(index, smoothPeriod, DEN);
Plot1: rbws = (num / (den + .0001)) * 100.0;
x = 0.1 * (rbws - 50);
Plor2: ftso = (( Math.exp(2 * x) - 1)/(Math.exp(2 * x) + 1) + 1) * 50;

// Check for signal events
prevFtso = FTSO[index-1];
sell = prevFtso lessThan topGuide AND ftso moreThan topGuide;
buy = prevFtso moreThan bottomGuide AND ftso lessThan bottomGuide;