Volume Accum Percent
Volume Accum Percent was authored by Omega Research, 1997. Highs, lows, closes and volume over a 21 bar period are mathematically manipulated to produce this histogram plot. The user may change only the period length. This indicator’s definition is further expressed in the condensed code given in the calculation below.
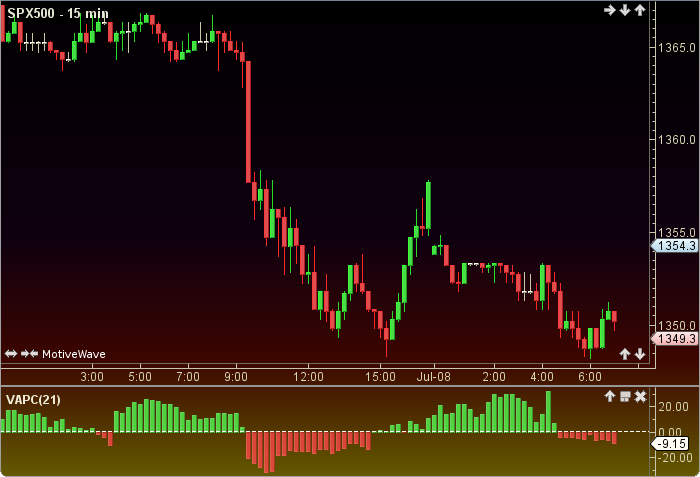
How To Trade Using Volume Accum Percent
A positive value shows and upward trend, and a negative shows downward trend. The Volume Accum Percent may be used in conjunction with other indicators. No trading signals are calculated.
How To Access in MotiveWave
Go to the top menu, choose Study>Volume Based>Volume Accum Percent
or go to the top menu, choose Add Study, start typing in this study name until you see it appear in the list, click on the study name, click OK.
Important Disclaimer: The information provided on this page is strictly for informational purposes and is not to be construed as advice or solicitation to buy or sell any security. Please see our Risk Disclosure and Performance Disclaimer Statement.
Calculation
//period = user defined, default is 21
//index = current bar number
xT = 0;
vapc = 0;
if (high - low != 0) xT = ((close - low) - (high - close)) / (high - low);
tVa = volume * xT;
tVol = sum(index, period, VOLUME);
tVaSum = sum(index, period, tVa);
if (tVol != 0) vapc = (tVaSum / tVol) * 100;
PlotHist: vapc;