Volatility Index Trading System
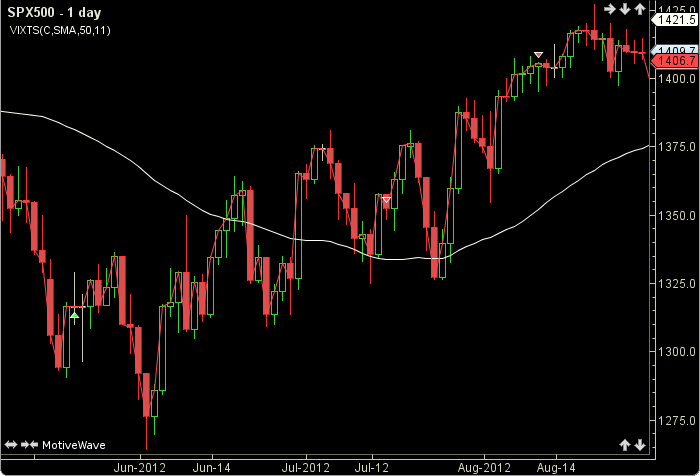
The Volatility Index Trading System (VIXTS) was described by Trent Gardner in the Stocks and Commodities Mag. Dec. 2012. The VIXTS compares a 50 day moving average of the VIX to its closing price. If the price stays above or below the 50 day average for the count a sell or buy signal will be generated. Set bar interval to 1 day. The user may change the input (close), method (SMA), period (50) and the count (11). This indicator’s definition is further expressed in the condensed code given in the calculation below.
How To Trade Using VIX Trading System
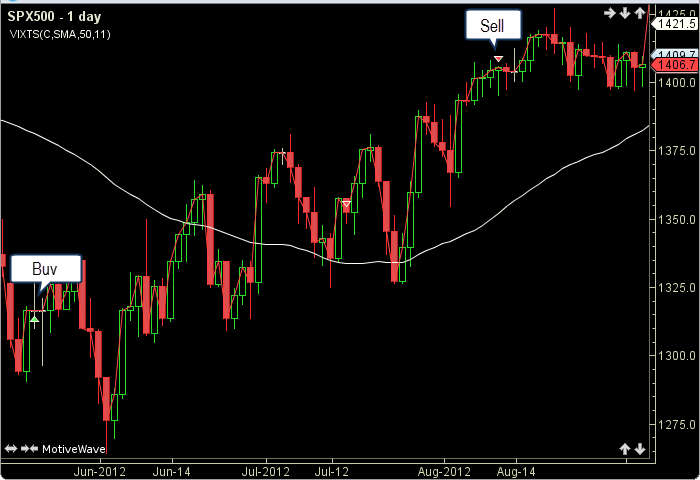
If the price stays above the VIXTS for 11 days a sell signal will be generated; conversely if the price stays below the VIXTS for 11 days a buy signal will be given.
How To Access in MotiveWave
Go to the top menu, choose Add Study, start typing in this study name until you see it appear in the list, click on the study name, click OK.
Important Disclaimer: The information provided on this page is strictly for informational purposes and is not to be construed as advice or solicitation to buy or sell any security. Please see our Risk Disclosure and Performance Disclaimer Statement.
Calculation
//input = price, default is closing
//method = moving average, default is SMA
//period = ma period, default is 50
//maxCount = default is 11
//index = current bar number
minCount = maxCount * -1;
Plot: vixts = ma(method, index, period, price);
prevCount = count[index-1];

if (price moreThan vixts AND prevCount moreOrEqual 0) count = prevCount + 1;
if (price lessOrEqual vixts AND prevCount lessOrEqual 0) count = prevCount - 1;
//Check for signal events
sell = count == maxCount;
buy = count == minCount;