Three Lines
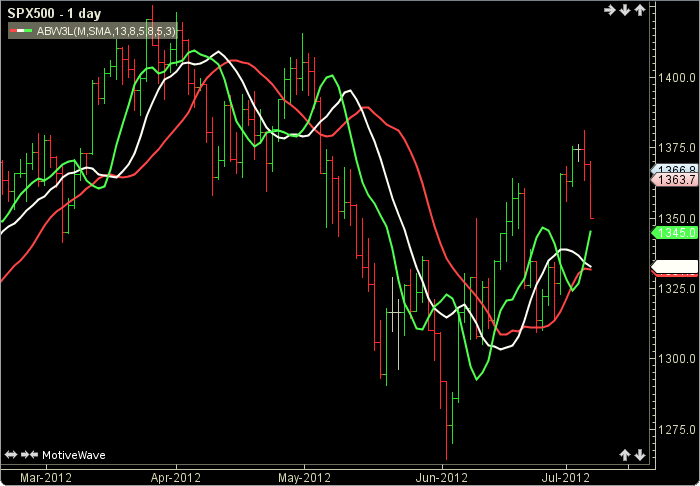
Three Lines by Bill Williams displays three displaced moving averages based on the midpoint price. The user may change the input (midpoint), method (SMA), periods and displace lengths. This indicator’s definition is further expressed in the condensed code given in the calculation below.
How To Trade Using 3 Lines
The Three Lines Indicator may be used in conjunction with other indicators as a trend indicator. No trading signals are given.
How To Access in MotiveWave
Go to the top menu, choose Study>Bill Williams>Three Lines
or go to the top menu, choose Add Study, start typing in this study name until you see it appear in the list, click on the study name, click OK.
Important Disclaimer: The information provided on this page is strictly for informational purposes and is not to be construed as advice or solicitation to buy or sell any security. Please see our Risk Disclosure and Performance Disclaimer Statement.
Calculation
//input = price (user defined, default is midpoint price)
//method = user defined, default is SMA
//period1 = user defined, default = 13
//displace1 = user defined, default = 8
//period2 = user defined, default = 8
//displace2 = user defined, default = 5
//period3 = user defined, default = 5
//displace3 = user defined, default = 3
//index = current bar number
Plot1: line1 = ma(method, index-displace1, period1, input);
Plot2: line2 = ma(method, index-displace2, period2, input);
Plot3: line3 = ma(method, index-displace3, period3, input);