Standard Deviation
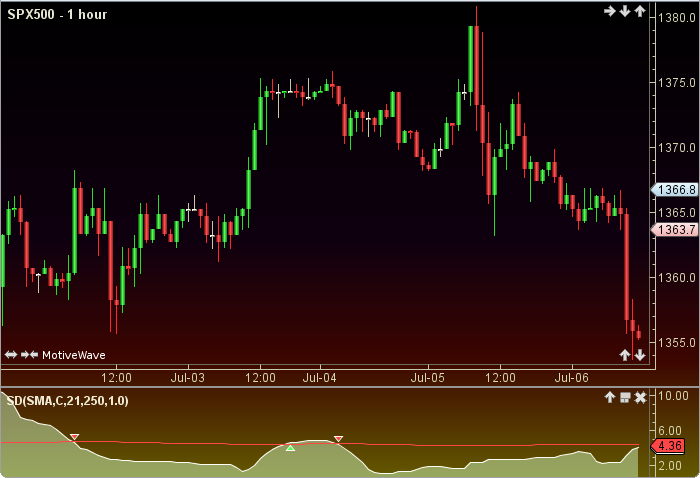
Standard Deviation (SD) is a statistical measure of the actual value compared to an average value, the greater the difference the higher the standard deviation. Two lines are plotted, the SD times a user defined factor, and a signal line which is a moving average of the SD. The user may change the input (close), method (SMA), period lengths and the standard deviation factor. This indicator’s definition is further expressed in the condensed code given in the calculation below.
How To Trade Using Standard Deviation
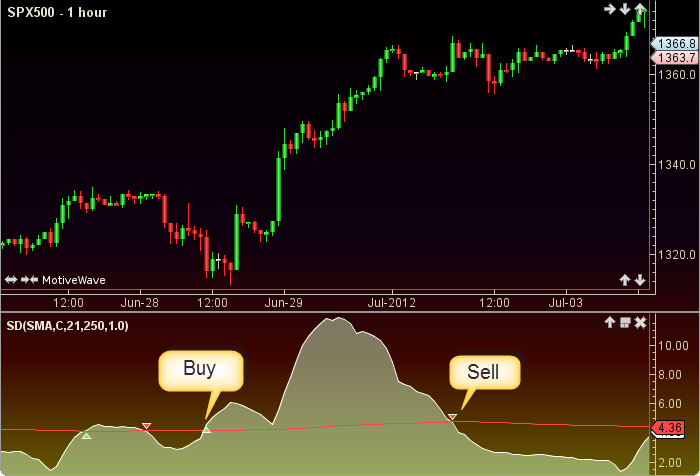
If the stdDev crosses below the signal line (downward trend) a sell signal is generated. Conversely, if the stdDev crosses above the signal line (upward trend) a buy signal is given.
How To Access in MotiveWave
Go to the top menu, choose Study>Performance>Standard Deviation
or go to the top menu, choose Add Study, start typing in this study name until you see it appear in the list, click on the study name, click OK.
Important Disclaimer: The information provided on this page is strictly for informational purposes and is not to be construed as advice or solicitation to buy or sell any security. Please see our Risk Disclosure and Performance Disclaimer Statement.
Calculation
//input = price user defined, default is closing price
//method = moving average user defined, default is SMA
//stdDev = standardDeviation
//stdFac = standardDeviationFactor user defined, default is 1
//ma = moving average, index = current bar number
stdDev = std(index, sdPeriod, input);
Plot1: stdDev = stdDev * stdFac;
Plot2: ma = ma(method, index, maPeriod, stdDev);
//Signals
sell = crossedBelow(stdDev, ma);
buy = crossedAbove(stdDev, ma);