RSI Divergence
The Relative Strength Index (RSI) itself, was authored by J Welles Wilder in 1978.
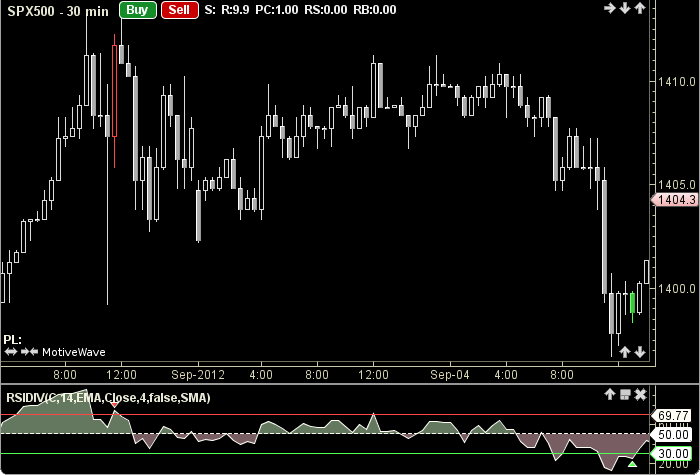
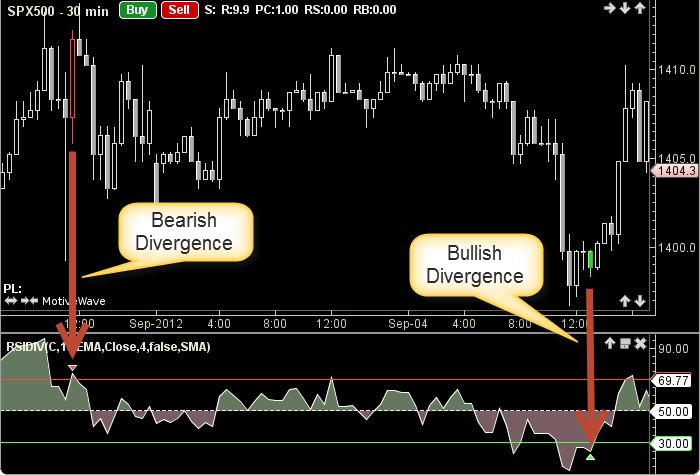
It is a momentum oscillator that measures the velocity and magnitude of the directional price by comparing upward and downward movements. The RSI Divergence refers to the direction of the RSI in relation to the direction of the price. The RSI Divergence will change the price bar color depending upon the type of divergence. Two types of divergence are possible. If the RSI is increasing and the price is decreasing a bullish divergence is occurring. Conversely, if the RSI is decreasing and the price is increasing a bearish divergence is under way.
Several options are allowed, including a trend method to smooth the price bar values. A high-low option is also given; it allows the trend to be determined from higher highs and lower lows (as opposed to higher and lower closes, for example). Adjustable guides are also provided to fine tune the trading signals. The user may change the RSI input (close), RSI period, RSI method (EMA), trend input (close), trend period, trend method option, method (SMA) and guide values. This indicator’s definition is further expressed in the condensed code given in the calculation below.
Click here for more information on the RSI.
How To Trade Using RSI Divergence
Adjust the top and bottom guides to control the quantity and quality of the trading signals. RSI values above 70 are considered overbought and therefore offer an opportunity to sell. RSI values below 30 are considered oversold and present an opportunity to buy. If a bullish divergence is occurring; and the RSI is below the bottom guide a buy signal will be generated. Conversely, if a bearish divergence is underway; and the RSI is above the top guide a sell signal will be given.
How To Access in MotiveWave
Go to the top menu, choose Study>Oscillators>RSI Divergence
or go to the top menu, choose Add Study, start typing in this study name until you see it appear in the list, click on the study name, click OK.
Important Disclaimer: The information provided on this page is strictly for informational purposes and is not to be construed as advice or solicitation to buy or sell any security. Please see our Risk Disclosure and Performance Disclaimer Statement.
Calculation
//RSI input=price, user defined, default is closing price
//RSI Period = user defined, default is 14
//RSI Method = moving average, user defined, default is EMA
//Trend input=price, user defined, default is closing price
//Trend Period = user defined, default is 4
//Use Trend Method = user defined, default is false
//Trend Method = moving average, user defined, default is SMA
Code may be available on request