RSI Bars
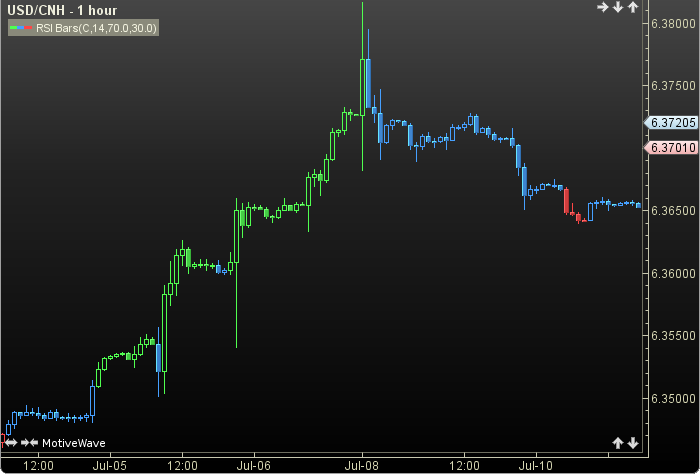
RSI Bars changes the color of the price bars if the Relative Strength Index (RSI) is above or below a certain value. The RSI was authored by Welles Wilder. RSI is a momentum oscillator that measures the velocity and magnitude of directional price movement by comparing upward and downward movements. The user may change the input (close), method (SMMA), period length and top-bottom values. This indicator’s definition is further expressed in the condensed code given in the calculation below. Click here for more information.
How To Trade Using RSI Bars
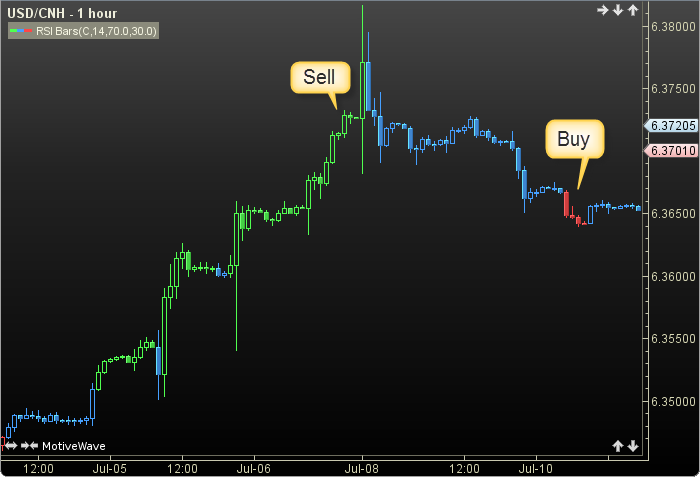
RSI Bars. RSI values below 30 are considered oversold and present an opportunity to buy. If the RSI crosses above the (user defined) top value a sell signal will be generated. Conversely, if the RSI crosses below the bottom (user defined) value a buy signal will be given.
How To Access in MotiveWave
Go to the top menu, choose Study>Bar Patterns>RSI Bars
or go to the top menu, choose Add Study, start typing in this study name until you see it appear in the list, click on the study name, click OK.
Important Disclaimer: The information provided on this page is strictly for informational purposes and is not to be construed as advice or solicitation to buy or sell any security. Please see our Risk Disclosure and Performance Disclaimer Statement.
Calculation
//input = price, user defined, default is closing price
//method = moving average (ma), user defined, default is SMMA
//period = user defined, default is 14
//top = user defined, default is 70
//bottom = user defined, default is 30
//MT = more than, LT = less than
//index = current bar number
diff = price - price[index-1];
up = 0, down = 0;
if (diff MT 0) up = diff;
else down = abs(diff);
avgUp = ma(method, index, period, UP);
avgDown = ma(method, index, period, DOWN);
RS = avgUp / avgDown;
RSI = 100 - ( 100 / (1 + RS));
//signals
setBarColor(RSI,top,bottom);
buy = crossedAbove(RSI, top);
sell = crossedBelow(RSI, bottom);