QStick
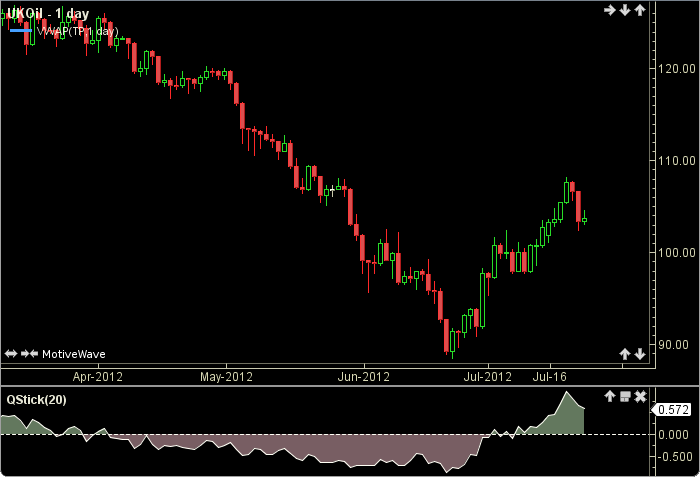
The QStick was authored by Tushar Chande. It identifies trends by plotting an N-period moving average of the differences between the opening and closing prices. Values greater than 0 indicate the majority of the last ‘N’ days have been up (buying pressure is increasing). The user may change the method (SMA) and period length. This indicator’s definition is further expressed in the condensed code given in the calculation below.
How To Trade Using QStick
No trading signals are calculated for this indicator.
How To Access in MotiveWave
Go to the top menu, choose Study>Tushar Chande>QStick
or go to the top menu, choose Add Study, start typing in this study name until you see it appear in the list, click on the study name, click OK.
Important Disclaimer: The information provided on this page is strictly for informational purposes and is not to be construed as advice or solicitation to buy or sell any security. Please see our Risk Disclosure and Performance Disclaimer Statement.
Calculation
//method = moving average (ma), user defined, default is SMA
//period = user defined, default is 20
//diff = difference, index = current bar number
diff = getClose(index) - getOpen(index);
Plot: ma = ma(method, index, period, DIFF);