MA High Low
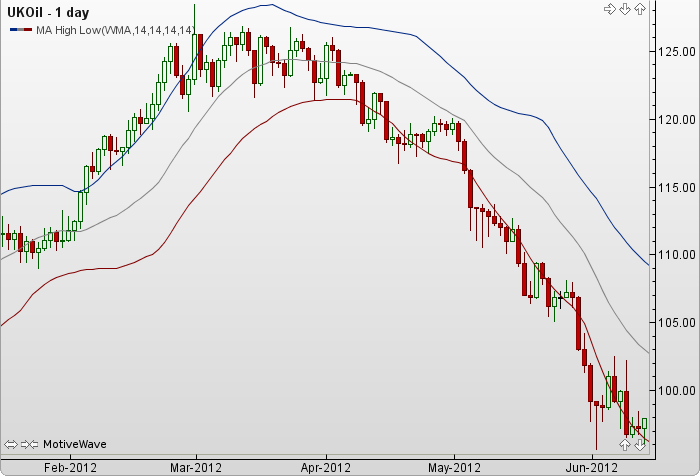
The MA High Low study displays two lines: a moving average of the highest high over a given period and the lowest low over a given period. The user may change the method (WMA), period and shift lengths. This indicator’s definition is further expressed in the condensed code given in the calculation below.
How To Trade Using MA High Low
No trading signals are calculated for this indicator.
How To Access in MotiveWave
Go to the top menu, choose Study>Custom>MA High Low
or go to the top menu, choose Add Study, start typing in this study name until you see it appear in the list, click on the study name, click OK.
Important Disclaimer: The information provided on this page is strictly for informational purposes and is not to be construed as advice or solicitation to buy or sell any security. Please see our Risk Disclosure and Performance Disclaimer Statement.
Calculation
//method = moving average (ma), user defined, default is WMA
//highPeriod = user defined, default is 14
//highMAPeriod = user defined, default is 14
//highShift = user defined, default is 0
//lowPeriod = user defined, default is 14
//lowMAPeriod = user defined, default is 14
//lowShift = user defined, default is 0
//index = current bar number
//high_line = ma( Highest(highPeriod), highMAPeriod )
//low_line = ma( Lowest(lowPeriod), lowMAPeriod )
highest = highest(index,  highPeriod, HIGH);
Plot1: TOP = calcMAAt(index, method, HIGHEST, highMAPeriod, highShift);
lowest = lowest(index, lowPeriod, LOW);
Plot2: BOTTOM = calcMAAt(index, method, LOWEST, lowMAPeriod, lowShift);
// Calculate the midpoint
Plot3: MIDDLE = (top + bottom)/2;