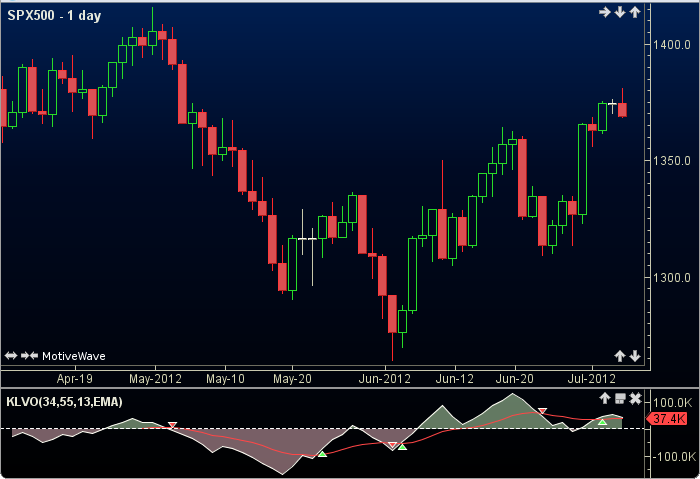
Klinger Volume Oscillator
The Klinger Volume Oscillator was developed by Stephen J. Klinger. It is a conformation indicator. It uses high, low, close and volume to create a volume force. This volume force (VF) is then turned into an oscillator by taking a fast EMA of VF and subtracting a slow EMA of VF. A signal line (KOS), which is an EMA of the Klinger Oscillator (KO), is plotted to trigger trading signals. The user may change the method (EMA), and period lengths. This indicator’s definition is further expressed in the condensed code given in the calculation below.
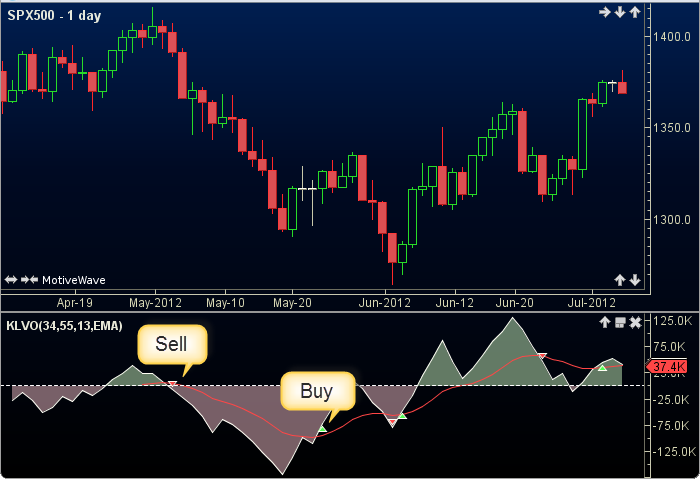
How To Trade Using Klinger Volume Oscillator
Although signals are generated as shown in the calculation, the Klinger Volume Oscillator is considered a conformation indicator and should be used in conjuction with other indicators.
How To Access in MotiveWave
Go to the top menu, choose Study>Volume Based>Klinger Volume Oscillator
or go to the top menu, choose Add Study, start typing in this study name until you see it appear in the list, click on the study name, click OK.
Important Disclaimer: The information provided on this page is strictly for informational purposes and is not to be construed as advice or solicitation to buy or sell any security. Please see our Risk Disclosure and Performance Disclaimer Statement.
Calculation
//method = moving average (ma) user defined, default is EMA
//fastPeriod = user defined, default is 34
//slowPeriod = user defined, default is 55
//signalPeriod = user defined, default is 13
//index = current bar number
lastCm = CM[index-1];
lastHigh = high[index-1];
lastLow = low[index-1];
lastClose = close[index-1];
lastDm = lastHigh - lastLow;
lastTrend = TREND[index-1];
if (lastTrend == null) lastTrend = -1;
if ((high + low + close) moreThan (lastHigh + lastLow + lastClose)) TREND = 1;
else TREND = -1;
dm = high - low;
if (TREND == lastTrend) CM = lastCm + dm;
else CM = lastDm + dm;
if (CM == 0) temp = -2;
else temp = abs(2 * (dm/CM -1));
VF = volume * temp * TREND * 100;
koFast = ma(method, index, fastPeriod, VF);
koSlow = ma(method, index, slowPeriod, VF);
Plot1: KO = koFast - koSlow;
Plot2: KOS = ma(method, index, signalPeriod, KO);
//Signals
buy = crossedAbove(KO,KOS);
sell = crossedBelow(KO, KOS);