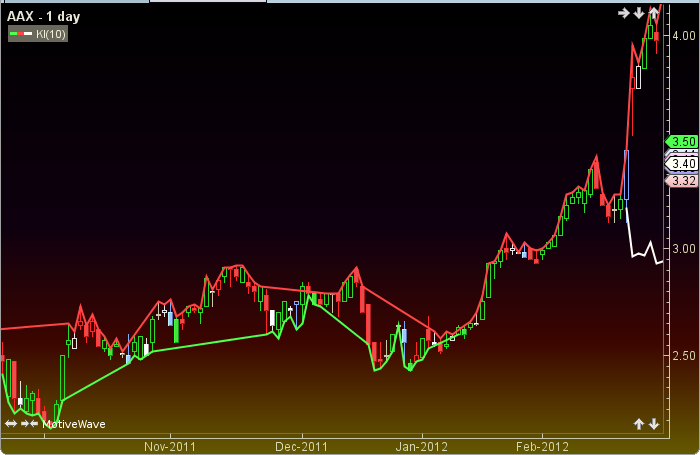
Kase Indicator
Kase Indicator by Cynthia Kase uses volume and Average True Range in its formula. The user may change the period length. This indicator’s definition is further expressed in the condensed code given in the calculation below.
How To Trade Using Kase Indicator
The Kase Indicator may be used in conjunction with other indicators. No trading signals are given.
How To Access in MotiveWave
Go to the top menu, choose Study>Bands>Kase Indicator
or go to the top menu, choose Add Study, start typing in this study name until you see it appear in the list, click on the study name, click OK.
Important Disclaimer: The information provided on this page is strictly for informational purposes and is not to be construed as advice or solicitation to buy or sell any security. Please see our Risk Disclosure and Performance Disclaimer Statement.
Calculation
//period = user defined, default is 10
//av = average
//sqrt = square root
//atr = average true range
//moreT = moreThan, lessT = lessThan
//index = current bar number
priorHigh = high[index-period];
priorLow = low[index-period]);
avVol = sma(period, index, volume);
avTR = atr(period);
kUp = kUp[index-1];
if (avTR moreT 0) kUp = (priorHigh/low) / (avVol * sqrt(period));
kDown = kDown[index-1];  //previous Kdown
if (avTR moreT 0) kDown = (high/priorLow) / (avVol * sqrt(period));
plot1 = null;
if (kUp moreT kDown) plot1 = low;
plot2 = null;
if (kUp lessT kDown) plot2 = high;
plot3 = null;
if (kUp == kDown) plot3 = (high + low) / 2;
Plot1: plot1;
Plot2: plot2;
Plot3: plot3;