Ichimoku Kinko Hyo
Ichimoku Kinko Hyo is a Japanese charting technique developed before World War II. Its goal is to portray at a glance where the price is heading and when will be the right time to enter or exit the market. Translated, Ichimoku Kinko Hyo means ‘a glance at an equilibrium chart’. The user may change the period lengths. This indicator’s definition is further expressed in the condensed code given in the calculation below.
How To Trade Using Ichimoku Kinko Hyo
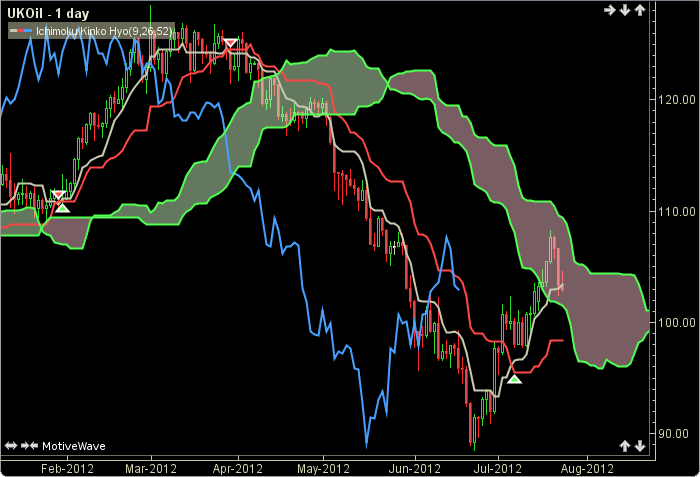
If the TS crosses above the KS a buy signal will be generated. Conversely, if the TS crosses below the KS a sell signal will be given.
How To Access in MotiveWave
Go to the top menu, choose Study>Overlays>Ichimoku Kinko Hyo
or go to the top menu, choose Add Study, start typing in this study name until you see it appear in the list, click on the study name, click OK.
Important Disclaimer: The information provided on this page is strictly for informational purposes and is not to be construed as advice or solicitation to buy or sell any security. Please see our Risk Disclosure and Performance Disclaimer Statement.
Calculation
//period1 = user defined, default is 9
//period2 = user defined, default is 26
//period3 = user defined, default is 52
highest = highest(index, period, HIGH);
lowest = lowest(index, period, LOW);
TS = (highest+lowest)/2);
//Kijun-Sen
highest = highest(index, period2, HIGH);
lowest = lowest(index, period2, LOW);
KS = (highest+lowest)/2;
// Chikou Span
CS = getClose(index+period2)); //shift backward by period2
//Senkou Span B
highest = highest(index, period3, HIGH);
lowest = lowest(index, period3, LOW);
SSB[index+period2]=(highest+lowest)/2); //shift Forward by period2
//Senkou Span A
SSA[index+period2] = (TS+KS)/2; //shift forward by period2
//Signals
buy = crossedAbove(TS, KS);
sell = crossedBelow(TS, KS);