Donchian Channels
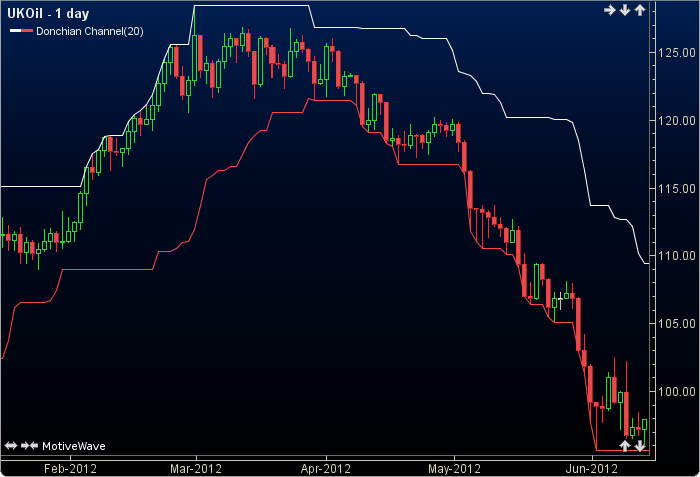
Donchian Channels were developed by Richard Donchian. They are displayed as two bands (upper and lower) which are calculated using highest and lowest prices. These bands are often used as a volatility indicator. The user may change only the period length. This indicator’s definition is further expressed in the condensed code given in the calculation below.
More informatrion.
How To Trade Using Donchian Channel
No trading signals are calculated for this indicator.
How To Access in MotiveWave
Go to the top menu, choose Study>Overlays>Donchian Channel
or go to the top menu, choose Add Study, start typing in this study name until you see it appear in the list, click on the study name, click OK.
Important Disclaimer: The information provided on this page is strictly for informational purposes and is not to be construed as advice or solicitation to buy or sell any security. Please see our Risk Disclosure and Performance Disclaimer Statement.
Calculation
//period = user defined, default is 20
//index = current bar number
Plot1: top = highest(index, period, HIGH);
Plot2: bottom = lowest(index, period, LOW);