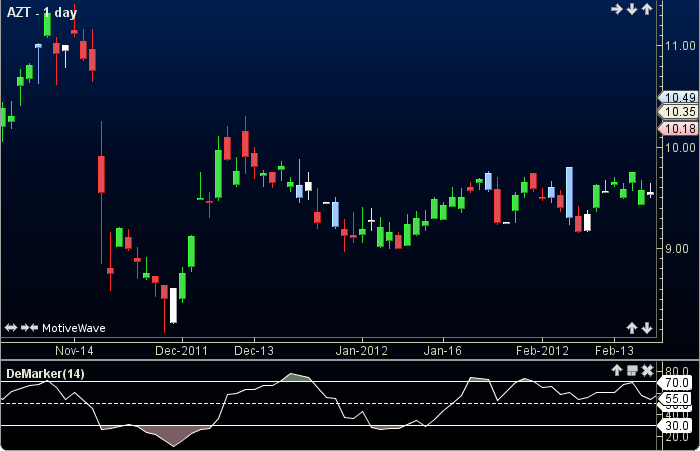
DeMarker
The DeMarker (DM) compares the most recent price action to the previous period’s price in an attempt to measure the demand of the underlying asset. DM is generally used to identify price exhaustion and market tops/bottoms. The user may change only the period length. This indicator’s definition is further expressed in the condensed code given in the calculation below.
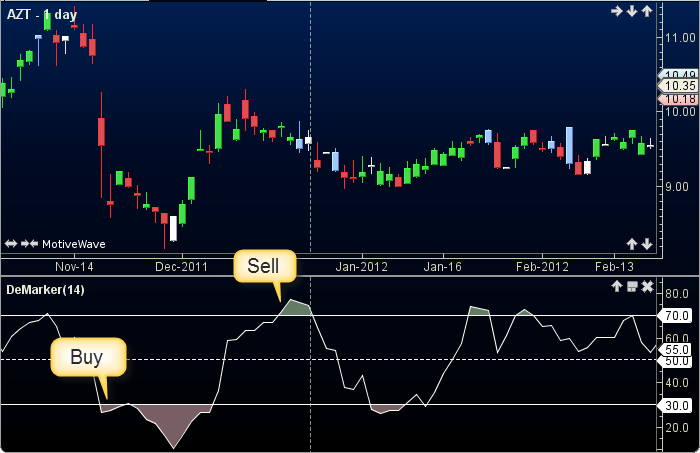
How To Trade Using DeMarker
Adjust the top and bottom guides to control the quantity and quality of the trading signals. If the DM crosses above the top guide a sell signal will be generated, Conversely, if the DM crosses below the bottom guide a buy signal will be given.
How To Access in MotiveWave
Go to the top menu, choose Study>General>DeMarker
or go to the top menu, choose Add Study, start typing in this study name until you see it appear in the list, click on the study name, click OK.
Important Disclaimer: The information provided on this page is strictly for informational purposes and is not to be construed as advice or solicitation to buy or sell any security. Please see our Risk Disclosure and Performance Disclaimer Statement.
Calculation
//period = user defined, default is 20
//LT = less than, MT= = more than
//index = current bar number
dmax = 0;
dmin = 0;
prevH = high[index-1];
prevL = low[index-1];
if (high MT prevH ) dmax = high - prevH;
if (low LT prevL) dmin = prevL - low;
maxMA = sma(index,  period, DMAX);
minMA= sma(index,  period, DMIN);
Plot: DM = (maxMA / (maxMA + minMA))*100;
// Signals
buy =  crossedAbove(DM, topGuide);
sell = crossedBelow(DM, bottGuide);