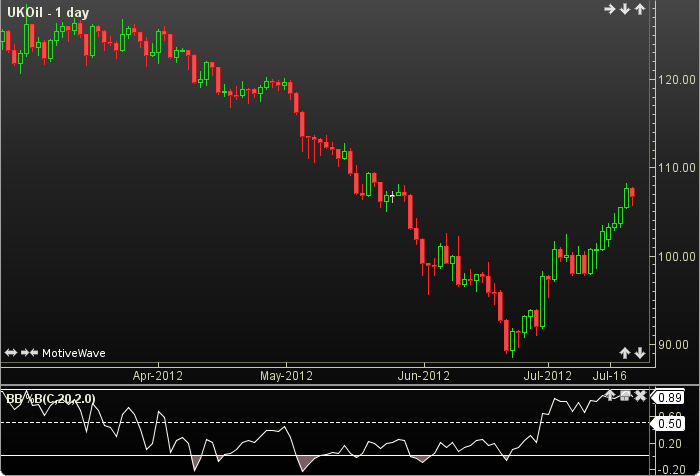
Bollinger Bands® %B
Bollinger Bands® was authored by John Bollinger in the 1980s. The Percent B (PB) plots the instrument’s price relative to the upper and lower Bollinger Bands®. The PB can be used to identify overbought and oversold conditions. The user may change the input (close), period length and standard deviation factor. This indicator’s definition is further expressed in the condensed code given in the calculation below. see Bollinger Bands.
How To Trade Using Bollinger Bands® %B
No trading signals are calculated for this indicator.
How To Access in MotiveWave
Go to the top menu, choose Study>General>Bollinger Bands® %B
or go to the top menu, choose Add Study, start typing in this study name until you see it appear in the list, click on the study name, click OK.
Important Disclaimer: The information provided on this page is strictly for informational purposes and is not to be construed as advice or solicitation to buy or sell any security. Please see our Risk Disclosure and Performance Disclaimer Statement.
Calculation
//input = price, user defined, default is close
//period = user defined, default is 20
//stdDev = standard deviation factor, user defined, default is 2
//sma = simple moving average, index = current bar number
ma = sma(index, period, input);
dev = std(index, period, input) * stdDev;
upperBand = ma + dev;
lowerBand = ma - dev;
Plot: PB = (price - lowerBand) / upperBand - lowerBand);