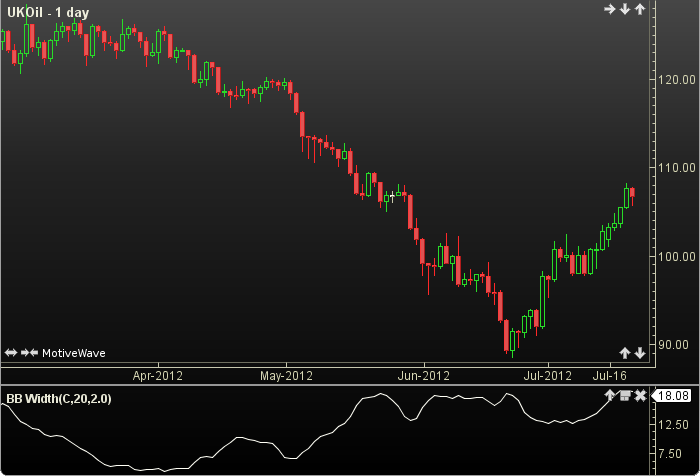
Bollinger Band Width
Bollinger Bands® was authored by John Bollinger in the 1980s. The Bollinger Band Width (BBW) plots the distance between the upper and lower Bollinger Bands®. This graph line represents the contraction and expansion of the bands based on recent volatility. A high BB width often indicates a slowing trend, while a low width indicates a forming trend. The user may change the input (close), period length and standard deviation factor. This indicator’s definition is further expressed in the condensed code given in the calculation below. see Bollinger Bands®.
How To Trade Using Bollinger Band Width
No trading signals are calculated for this indicator.
How To Access in MotiveWave
Go to the top menu, choose Study>General>Bollinger Band Width
or go to the top menu, choose Add Study, start typing in this study name until you see it appear in the list, click on the study name, click OK.
Important Disclaimer: The information provided on this page is strictly for informational purposes and is not to be construed as advice or solicitation to buy or sell any security. Please see our Risk Disclosure and Performance Disclaimer Statement.
Calculation
//input = price, user defined, default is close
//period = user defined, default is 20
//stdDev = standard deviation factor, user defined, default is 2
//std = standard deviation
//index = current bar number
dev = std(index, period, input) * stdDev;
Plot: BBW = 2 * dev;